

One of the puzzling aspects of the self-assembled QDs is that the nucleated 3D volume is far larger than that being deposited in the narrow coverage range where the entire nucleation process is completed. Resercher from NAST Centre have studied a peculiar feature, recently discovered [1], at the origin of this phenomenon, which is associated with mature 3D QDs,
i.e. the erosion of the step edge surrounding dots. This is clearly shown in Figure 1 which compares two areas of the surface of InAs, with coverage 1.54 ML (panel (a)) and 1.61 ML (panel (b)), where the average volume of the 3D-QDs amounts to 220 nm3 and 340 nm3, respectively. QDs are observed nucleating preferentially at the upper side of the step edges, as shown in panel (a). Comparing images for successive coverages one observes that QDs close to the step edge (A in panel (a)) progressively erode the step edge (B) until they appear detached (C in panel (b)), as shown in the schematic pictures A-D below the topographies. Such erosion is evident for dots over the step edges but is unclear for dots nucleated on flat areas of the surface. Nevertheless, signs of erosion of the surface plane surrounding dots (QDs labeled “D” in panel (c)) were observed for growths at higher temperature 522°C and coverages (2.4 ML). In the last case the larger size of the dot (average volume 1500 nm3) and, consequently, the larger strain energy at its base, could account for the erosion. However, even at 500°C a reduced plane-erosion cannot be excluded because of the finite tip resolution.
As for other systems [2-5], substrate erosion may be favored in this case by the In-Ga intermixing which draws material from the substrate to create the alloyed island. This interpretation is supported by the work of Cullis et al. [6] on InxGa1-xAs/GaAs, which predicts, for x=1, the largest elastic energy-per-atom and the highest In concentration in the upper layers of the QDs [6-8].
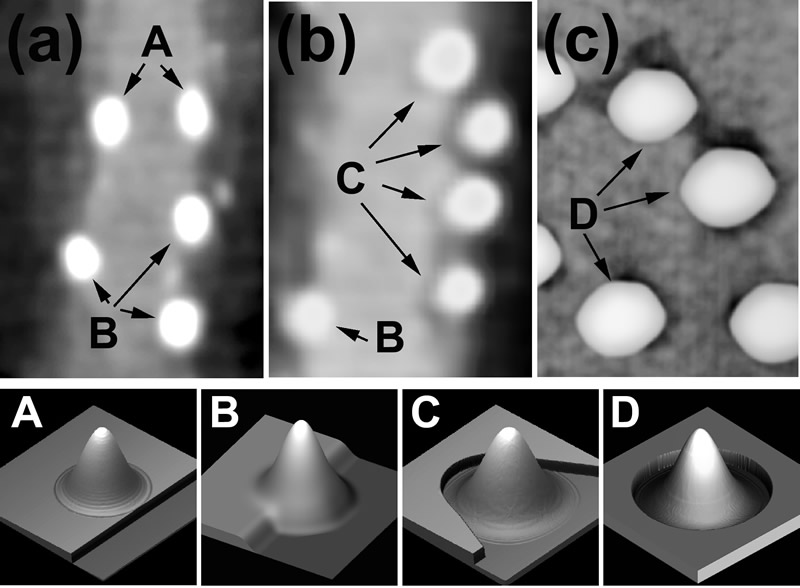
Figure 1. 120×160 nm2 AFM images for coverages of 1.54 ML (a) and 1.61 ML (b). “A” are QDs nucleated over the step edge, “B” are QDs that have partially eroded the step edge, and “C” are QDs that have completely eroded it. (c) 80×120 nm2 AFM image showing plane erosion occurring for 2.4 ML InAs growth at 522°C (“D” are QDs after erosion). The bottom panels show schematic 3D views of QDs before and after the step or plane erosion [1].
Around the QD, a compressive strained area forms where the elastic energy differs from that of the WL far from the island by an amount that is large and positive; inside the dot, instead, it is negative [9]. The minimum value is due to the partial strain relaxation inside the dot; the maximum, at the periphery, is due to the strain propagation along the interface which increases the misfit between the underlying substrate and the WL encircling the dot. We speculate that, because of this strain profile, the detachment rate of adatom from steps is higher than the attachment rate, favoring the consumption of the step.
In Figure 2 the total dot volume is plotted as a function of the evaporated In amount. Fig. 2 highlights the increase of the dot volume in the 2D-3D transition region for Continuous Growth (CG), Growth Interrupted (GI) and Growth Interrupted on very flat samples (GI-flat). This increase is well beyond the volume of the material being deposited (straight line in the figure). Two regions with different slopes can be distinguished: in the range 1.6-1.8 ML, the dependence of the dot volume on coverage is linear with slope Ft ≈ F0 for all the samples, where F0 is the slope of straight line representing the volume being deposited by the impinging InAs flux. Above 1.8 ML, the volume increases at the same rate F0 of the coverage. It is worth underlining that this volume behavior is a clear evidence of the large surface mass transport from the 2D to the 3D phase at the very initial stage of the transition. This can be quantified Δθ=0.9 ML for the CG and GI samples, and Δθ =0.5 ML for the GI-flat. Such mass transfer ends at 1.8 ML, above which volume increases solely at the expense of the incoming flux. The ensuing discussion concerns the microscopic origin of the excess volume. AFM topographies allow for a lower estimate of the amount of eroded material around islands, ΔV=0.3 ML [1] sets a lower limit to the surface mass current due to erosion.
 Figure 2: QDs volume plotted as a function of InAs coverage for the CG, GI and GI-flat samples. The lowest straight curve indicates the InAs flux above the 2D-3D transition
Therefore, in addition to surface segregation and substrate intermixing, a relevant fraction of the dot volume comes from step erosion; not enough, however, to account for all the 3D volume in excess. A further contribution can be accounted to floating In atoms observed at the very beginning of nucleation [10,11]. A good input comes from the comparison of the total QDs volume in the CG, GI and GI-flat samples [12], shown in Figure 2. While for the CG and GI samples the excess volume ΔθCG, ΔθGI≈0.9 ML, for the GI-flat ΔθGI-flat≈0.5 ML, thus suggesting an erosion dependence by the initial wetting layer morphology. This finding is still more interesting if compared with the step density per unit area for all the samples analyzed. Just before the transition starts, the CG and GI surfaces present a value of density of steps ρCG= ρGI =23μm-1, while for the GI-flat is ρGI-flat= μm-1. The relation between the step density and the excess volume is thus apparent: in particular, if we notice that the ratio ρGI-flat/ρCG is similar to ΔθGI-flat /ΔθCG and that the step erosion occurs with the same intensity for each sample, we infer that large part of the excess volume has likely to be accounted by step erosion (and, in general, by wetting layer erosion). Such interpretation is strengthened by the disappearance of 2D islands during the large QDs density explosion, i.e. when step erosion is operating.
The origin of the transition between the two families of QDs can be understood if we consider the evolution, as a function of coverage, of the total volume contained in large QDs only. Above 1.8 ML, the QDs excess volume increase reverts to being compatible with F0. The extra quantity of matter amounts to roughly 0.9 ML. We have set a lower limit for erosion to 0.3 ML. Even though the erosion could be responsible for the whole supplementary 0.9 ML, a further contribution could arise from substrate intermixing and In segregation [10].
References
[1] E. Placidi, F. Arciprete, V. Sessi, M. Fanfoni, F. Patella and A. Balzarotti, Appl. Phys. Lett. 86, 241913 (2005)
[2] W. Seifert, N. Carlsson, J. Johansson, M. Pistol and L. Samuelson, J. Cryst. Growth 170, 39 (1997)
[3] X.Z. Liao, J. Zou, D.J.H. Cockayne, Z.M. Jiang, X. Wang and R. Leon, Appl. Phys. Lett. 77, 1304 (2000)
[4] S.A. Chaparro, Y. Zhang and J. Drucker, Appl. Phys. Lett. 76, 3534 (2000)
[5] N. Motta, J. Phys. Cond. Matter 14, 8353 (2002)
[6] T. Walther, A.G. Cullis,D.J. Norris, M. and Hopkinson Phys. Rev. Lett. 86, 2381 (2001)
[7] A. G. Cullis , D. J. Norris , T. Walther, M. A. Migliorato and M. Hopkinson Phys. Rev. B 66, 081305 (2002)
[8] A.G. Cullis, D.J. Norris, M.A. Migliorato, M. Hopkinson, Appl. Surf. Sci. 244, 65 (2005)
[9] A.L. Barabàsi, Appl. Phys. Lett. 70, 2565 (1997)
[10] F. Patella, M. Fanfoni, F. Arciprete, S. Nufris, E. Placidi, and A. Balzarotti, Appl. Phys. Lett. 78, 320 (2001)
[11] H. Tsuyoshi, S. Tsukamoto, and Y. Arakawa, Jap. J. Appl. Phys. 45, L777 (2006)
[12] E. Placidi, F. Arciprete, F. Patella, M. Fanfoni, E. Orsini and A. Balzarotti, J. Phys. Cond. Mat. 19, 225006 (2007)
Related Information
Prof. F. Patella
InAs/GaAs(001)