

- Home
- Research Highlights
A nondestructive stratigraphic and radiographic neutron study of Lorenzo Ghiberti’s reliefs from paradise and north doors of Florence baptistery
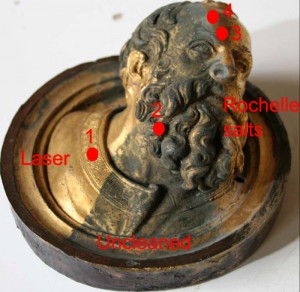 A neutron study on two gilded bronze reliefs by Lorenzo Ghiberti is presented. The two reliefs, representing heads of prophets, come from the north and east doors of the Baptistery of Florence.The east door will be permanently located at the Museo dell’Opera di Santa Maria del Fiore museum at the end of its restoration, which is still in progress at the Metals Conservation Department of the Opificio delle Pietre Dure in Florence. The north door is kept in the original site, on the north facade of the Florentine Baptistery. Both reliefs exhibit critical aspects regarding their state of conservation in particular the stability of the gold layer on the bronze surface. Moreover the east head presents a remelting of which extension and composition are still unknown. The present work describes a non-destructive study of the subgilding area and bulk. The two main objectives of such analyses are: 1 to study the manufacturing technique and state of conservation of the reliefs; and 2 to assess the two cleaning techniques laser cleaning and Rochelle salts chemical cleaning used by the conservators during the restoration process of the east door. The experiment was carried out using prompt gamma-ray activation imaging combined with neutron radiography and conventional neutron radiography. The former method was applied to map the elemental composition of the two reliefs, while neutron radiography was used to investigate the bulk. The results provide significant information about subsuperficial areas, elemental composition of the objects from the surface down to adepth of 1 mm below gilding, and bulk structure of the remelting. Such information will guide the curators in the selection of the most suitable microclimatic conditions for the exhibition of the east door and for future conservation work on the north door.
© 2009 American Institute of [Physics. doi:10.1063/1.3204514]
G. Festa, C. Andreani, M. P. De Pascale, R. Senesi, G. Vitali – Dipartimento di Fisica and Centro NAST (Nanoscienze, Nanotecnologie & Strumentazione), Università degli Studi di Roma Tor Vergata, Via della R. Scientifica 1, 00133, Rome, Italy
S. Porcinai, A. M. Giusti – Opificio delle Pietre Dure, Viale Strozzi 1, 50129, Florence, Italy
R. Schulze, P. Kudejova – Institute for Nuclear Physics, University of Cologne, Zülpicher Str. 77, 50937 Köln, Germany
L. Canella, P. Kudejova – Institute for Radiochemistry, Technische Universität München, Walther-Meißner-Str.3D -85748 Garching, Germany
M. Mühlbauer, B. Schillinger and the Ancient Charm Collaboration – Forschungsneutronenquelle Heinz Maier-Leibnitz (FRM II)/Physikdepartment E21,Technische Universität München, Lichtenbergstraße 1, 85747 Garching, Germany
(Received 2 April 2009; accepted 14 July 2009; published online 13 October 2009)
Bottom-up Nanofabrication by Lasers and Scanning Probes
The idea that bottom up nanofabrication can be achieved by the joint use of nanometrically controlled sharp tips and electromagnetic radiation. If we think of an irradiated STM tip as an electromagnetic antenna operating at optical rather than radio frequencies, we can understand how, in the vicinity of its highly curved apex, extremely high electromagnetic field intensities can be achieved. This well known fact is at the base of the so called “Surface” Enhanced Raman Spectroscopy, where the field enhancement is in fact due to nanometric corrugations of the surfaces; but it can also be exploited to bring the high intensity e.m. field where we want by a piezo controlled nanometric tip. Such intense radiation can be used for all the purposes for which we use lasers in the macro world: ablation, melting, recrystallization, welding, photoionization, spectroscopy and spectroscopic imaging. There are several advantages in this: the most obvious is that in the near field of the tip we can obtain concentrated radiation in a region smaller than the diffraction limit; more easily, we can obtain radiation effects in regions smaller 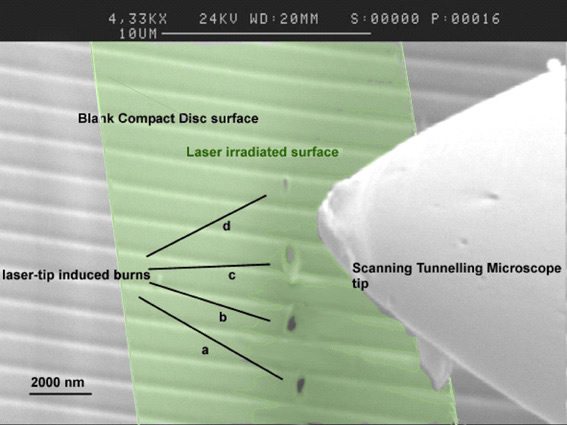 than the practically used focal volumes, which are often hundreds of microns wide. As a secondary advantage, we can deliberately increase the focal region in order to obtain a smaller dependence on the alignment precision, on vibrations, on thermal effects, still retaining nanometric resolution. The other obvious advantage is the ability to subtract or add material from a surface at the nano scale, and characterize what we have done, both morphologically and spectroscopically, in real time by the same apparatus. In the following figures we report an example of holes burnt in an optical Compact Disk by mildly focussed laser radiation impinging on a STM tip, as imaged by Scanning Electron Microscopy; and different examples of spatially resolved depositions of both biological (the aminoacid tryptophan) and metallic (lead) material on flat surfaces as imaged by AFM and STM.
Burns onto a blank CD surface are produced by laser pulses at 540 nm, irradiating the surface at very low angle, when the STM tip is brought close to the tunnelling distance. The laser beam is mildly focussed by a 500 mm focal length lens so that the beamwaist is of the order of 102 microns, much wider than the burns size, as evidenced by the green shaded area.
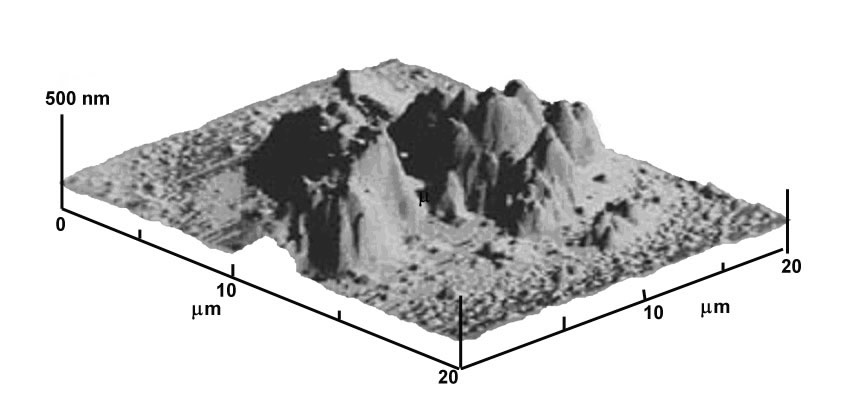 A deposition of the aminoacid tryptophan is obtained by photoionizing gas phase neutral molecules, as vaporized from a solid sample, under a micrometric electrode positioned 20 microns above the surface. The laser beam size is again of the order of 102 μm, while the deposition, as imaged by AFM here, is 20 μm.
Exploiting the narrow resonant excitation of the first excited electronic state of lead we can photoionize laser ablated atoms and pin them down on the underlying surface by an applied electric field. Real time STM imaging shows that the spot size depends on the tip-surface distance. Rastering the tip over the surface produces a square deposition of photoionized atoms.
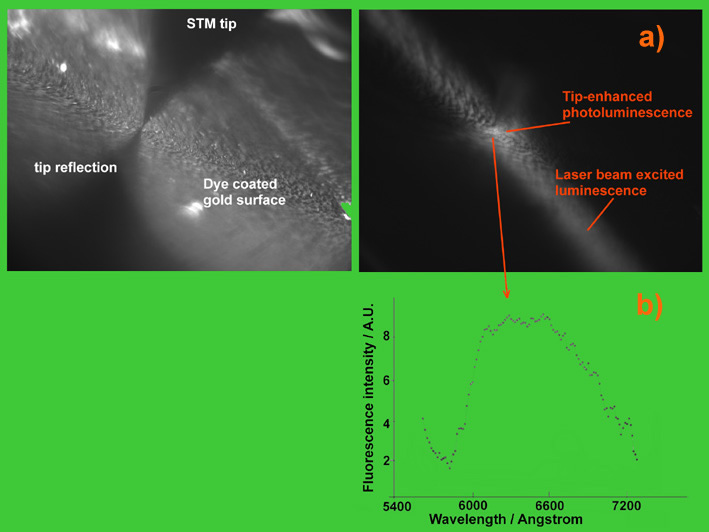
The next figure shows an optical microscopy view of the tip-enhancement of the fluorescence excitation as measured on a layer of the organic dye Rhodamine 6G.
The spectral distribution of the photoluminescence collected from the most luminous spot under the tip ensures that the dye molecules are not damaged. This technique thus ensures the ability to characterize spectroscopically micro-nano selected regions.
| Related Information Dr. P. Morales ENEA |
Laser assisted fabrication of biomolecular sensing microarrays
The Pulsed Laser Deposition technique is used in these experiments in conjunction with micro and nanopatterning techniques to produce very high density arrays of localized active biomolecular layers. Such patterned layers of homogeneous or heterogeneous biomolecules are particularly interesting for the accomplishment of high density biosensing arrays.
The technique is described in Figure 1. To achieve the best yield in the activity of deposited biomolecules, these are pulsed laser ablated from a frozen solution target maintained at approximately 150K on the tip of a liquid nitrogen cooled cold finger cryostat in vacuo (pressure is approximately 10-3 mbar). The tip faces the optical window of the vacuum vessel and is exposed to the laser beam pulses, mildly focussed by a 30 cm focal length lens. The solution is doped by a suitable molecule absorbing in a wavelength range away from the absorption of proteins (salicylaldeheyde, 330 nm – 360 nm) and irradiated by the third harmonic of a Q-switched Nd-YAG laser (355 nm). This maximizes sublimation preserving the proteins. The target surface is visually inspected during ablation by a stereoscopic microscope.
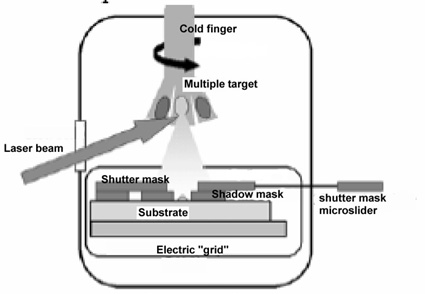
Figure 1
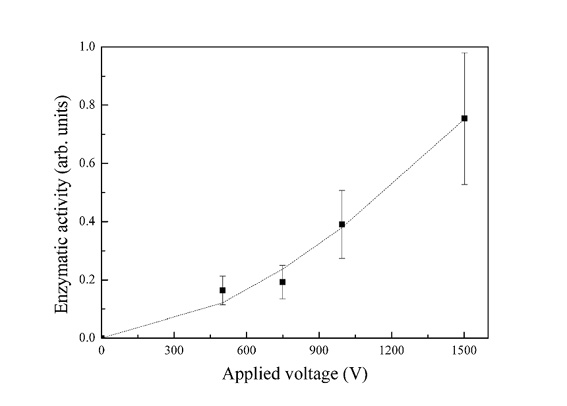
Figure 2
The ablated molecular jet is highly ionized and is thus subject to a static electric field applied between target and substrate, driving the ions to the deposition substrate. Micrometric patterning is achieved by a shadow mask fixed on the substrate and by a microtranslated shutter mask selecting the locations to be coated. On the other hand, nanometric patterning was only attempted with the enzyme horseradish peroxidase by electron beam lithography of a polimethylmethacrilate film, followed by pulsed laser deposition and by liftoff in acetone.
A multiple tip rotary cold finger allows three different molecular species to be ablated in a single vacuum run. The formed layers are found to be biologically functional; in the case of the enzyme horseradish peroxidase in particular, biological activity is assessed by measuring the absorption of the enzymatic reaction products, namely the absorption of the enzymatically oxidized substrate ABTS; the enzymatic activity of horseradish peroxidase coated specimens is found to increase strongly with the applied field as reported in Figure 2, due to better collection on the sample and to little damage of the protein structure in spite of the energetic impact. These data suggest that not only ablated neutral proteins, but also ionized molecules accelerated to the surface retain their biological activity. Above 1500 V electrical discharge easily occurs with our setup, which destroys the molecular layer, so that very little or no biological activity is detected on the sample.
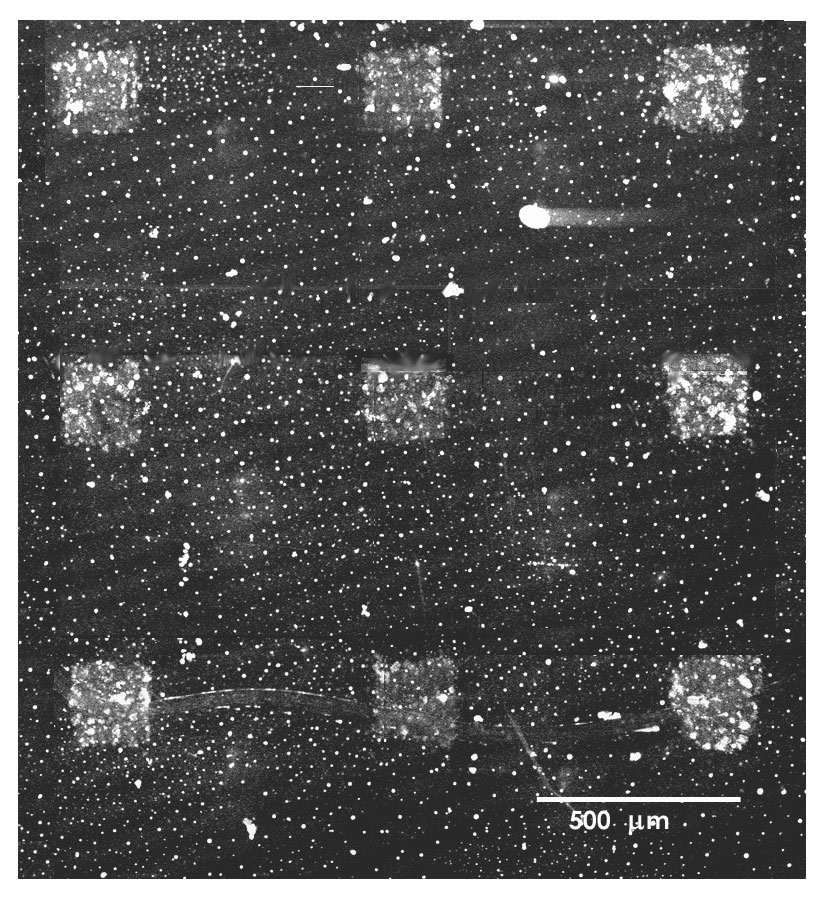
Figure 3
The following image (Figure 3), collected by a laser induced fluorescence confocal microscope, shows micrometric patterns of green fluorophore tagged anti-human Immunoglobuline that has reacted on a laser deposited stenciled deposition of Human Immunoglobuline G.
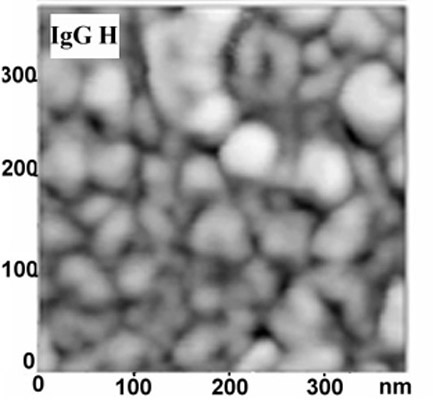
Figure 4
Fig. 4 (left) is an AFM detail of the layer structure, showing clustering of Immunoglobulines G, that have a size of approximately 3×7 nm, into larger lumps; only few of the observable structures have sizes comparable to that of single Immunoglobuline molecules. The layer thickness, as measured on manufactured step edges is between 5 and 10 nm, corresponding approximately to 2-3 stacked molecules.

Figure 5
Fig. 5 shows a nanopatterned horseradish peroxidase layer as imaged by AFM in intermittent contact mode and phase contrast, demonstrating the possibility to obtain extremely dense biomolecular arrays.
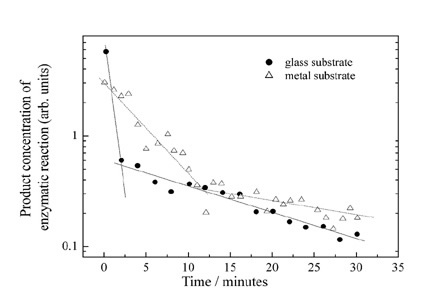
Figure 6
The decrease of the enzymatic activity of a coated specimen repeatedly rinsed in a water solution supplies a qualitative measure of the adhesion of the laser deposited molecules onto the surface. Figure 6 reports such biological activity decrease for layers deposited on a glass and on a stainless steel surfaces.
Two important features should be observed. Both substrates show a dual beaviour, a fast decrease at first followed by a much slower decrease. Secondly, the metal substrate shows a slower biological activity decrease with respect to the glass substrate; the adhesion of the laser deposited layer is thus higher on metal than on glass. We believe this behaviour is due to the fact that the effective electric field between the molecular source and the glass substrate quickly decreases while deposited ions charge up the surface. Therefore the average kinetic energy of the molecules is lower when they impact on the glass substrate than on the metal one. The deformation of the proteic globule, which we believe to allow a high number of weak interactions to be established, is consequently higher on metals, giving rise to better adhesion. AFM measurement of the layer thickness with increasing rinsing time shows that the thickness decreases very quickly at first, soon reaching a value of approximately 5 nm, very close to the monolayer value. The rinse time necessary to reach the monolayer always corresponds to the time needed to reach the slope change in the above plot. The monolayer is then much harder to remove from the surface, and the enzymatic activity of the specimen consequently is well detectable after 24 hours.
To show that this methodology can indeed supply heterogeneous biosensing arrays of micrometrically resolved thin film islands of different active proteins, we fabricated a simple immunosensing microarrays using two different immunoglobulines (IgG human and IgG mouse); of each we deposited three spots at random in a 3×3 matrix, while the remaining three locations were coated by a platinum thin film for control of the mask alignment. The platinum spots are visible by an ordinary microscope in light field while they are non fluorescent under excitation in the blue and green region. The specific antibodies for the IgG Human and IgG Mouse molecules were tagged with green and red emitting fluorophores respectively and incubated on the laser deposited specimen for 25 min. Fig. 7a shows a microscope image of the specimen in light field, where only the platinum spots are visible, while 7b shows the same specimen after incubation with a solution containing both antibodies and dual excitation at 488 and 514 nm. We find the green and red spots as expected on the IgG Human and IgG Mouse spots respectively, while no emission is visible from the platinum coated locations.
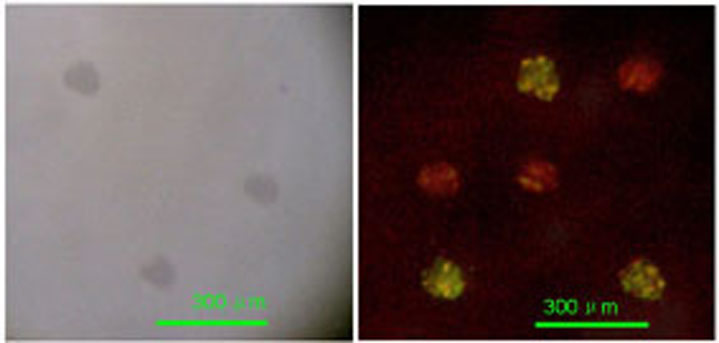
Figure 7
Related Information
Dr. P. Morales ENEA
3D Polymeric Scaffolds For Soft Tissue Engineering
Tissue engineering emerged in the early 1990s to address limitations of organ transplantation and synthetic tissue replacements, focusing on coupling cells and a biocompatible matrix known as a scaffold [1]. Since then, some clinical success has been obtained for hard tissues, such as bones and cartilages [2], and for bidimensional soft tissue, such as skin and cornea [3], while the reconstruction of more complicated soft tissues is far more challenging. In particular, cardiovascular diseases are the main cause of death in the western world and there is an impelling need for new solutions to treat hearts damaged by myocardial infarction and to address the shortage of heart donors. Tissue engineering approaches are mainly based on the use of 3D biocompatible, bioerodable scaffolds and cardiac cells to reconstitute contractile cardiac muscle-like tissues in vitro that might be utilized for the replacement of diseased myocardium in vivo [4,5]. One order of problems consists in the identification of the proper source of cells. Recent advances in stem cell research now offer a promising cell source for the treatment of heart failure, due to their ability to self-renew and their potential to differentiate into the specialized cells [6]. However, this is not sufficient for the success of the tissue reconstruction. A suitable interfacing between cells and scaffold is necessary for maintaining the activity of functional cells, regulating cell behavior, and reconstructing three-dimensional (3D) tissues. The scaffold must exhibit biocompatibility and biodegradability, porosity with adequate pore size to favor cell attachment and growth, as well as to facilitate the diffusion of nutrients to and waste products from the implant.
Amongst the various materials employed for tissue engineering scaffolds, synthetic polymers such as polycaprolactone (PC), polyglicolide (PGA), polylactide (PLA), and their copolymers have drawn considerable attention due to their processability. The selection and design of the material is crucial to yield physical and geometrical characteristics at different length scales, necessary to reproduce the tissue complexity at the cell-scaffold interface. Figure 1 shows the features of a cardiac tissue at different length scales: (i) an optical micrograph of a heart tissue section showing that vascular ducts have size at the millimetre scale, (ii) a scanning electron (SEM) micrograph of cardiac stem cells showing that their size is of about 20 μm [7], and (iii) a scheme of the extracellular matrix (ECM) components at the nanometre scale.
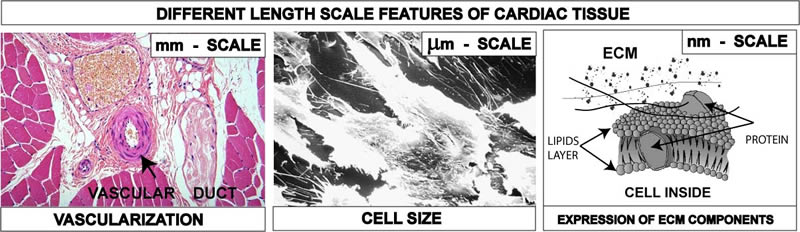
Figure 1
Figure 1: Different length scales of cardiac tissue to be integrated into the scaffold: mm scale for vascularization and nutrition, μm scale for cell accomodation, nm scale for the expression of ECM components.
The scaffold should incorporate in a single construct the information that can trigger the reproduction of the cardiac tissue with all the different features. Therefore, approaches in scaffold design must be able to create hierarchical porosities in a single construct, at the millimetre scale to help nutrition and vascularization, at the micrometer scale to accommodate cells, and at the nanometre scale to favour the expression of extra-cellular matrix components, with the desired chemical and mechanical functions. The importance of producing three-dimensional structures with porosities at scales from the nanometre to millimetre level has been reported mainly for osteoblasts, to influence the interaction between cells ad scaffold in terms of mass-transport requirements for cell nutrition, migration and attachment [8]. In some cases the emphasis has been put onto the nanoscale features needed by the scaffold, again in most of the cases for bone treatments and drug delivery [9]. Although there are certainly similarities amongst the various cells, there are also specificities for the different tissues, and what is valid for bones should be critically evaluated, say, for heart.
Several processing techniques have been developed over the past two decades to cast a large variety of materials into scaffolds suitable for the many different applications of tissue engineering and cell types (e.g. soft vs. hard tissues). Note worthily, none of them has emerged universally yet as the superior choice over the others, being all three currently active research topics. The strategy followed by researchers of NAST Centre is to develop several low-cost and user-friendly technologies that can be opportunely tuned to fabricate matrices with controlled architecture and morphological features, to match the requirements of hierarchical porosity and roughness that mimic the cell native surroundings. Some of these technologies, examined in here, are porogen leaching, phase separation and electrospinning [10].
1) Porogen leaching techniques involves the use of suitable porogens to be introduced into the polymer matrix and subsequently removed to generate porosity within the scaffold itself. The size and shape of the pores are entirely determined and tailored by those of the porogen chosen. For example, paraffin micro spheres of different size can be ad hoc synthesized and selected as porogen agents(Figure 2 – left). The resulting polymeric scaffold is shown by the SEM micrograph in Figure 2 (right), demonstrating spherical porosity in a close packed arrangement. The inset picture contains a cross section of the scaffold confirming a spherical open structure with communication paths between neighboring spherical holes. The opportune selection and preparation of the porogen as well as the balance of the polymer/porogen ratio allows manufacturing controlled scaffolds in terms of porosity and pore shape and size.

Figure 2a
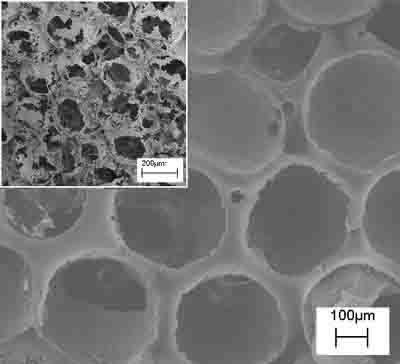
Figure 2b
Figure 2: SEM micrographs of poly-L-Lactic acid, PLA, scaffolds prepared by paraffin leaching techniques. The paraffin spheres (left) leached out from a polymeric matrix leaving controlled open porosity (right) (the insert reports the cross-sectional view).
2) The phase separation technique is based on a thermodynamic demixing of a homogeneous polymer-solvent solution into a polymer-rich phase and a polymer-poor phase. In other words, the procedure discussed here consisted in a solid-liquid extraction of the solvent from a polymer-solvent frozen solution, the solvent acting as a porogen agent. It is possible to tune the architecture (in terms of morphology and porosity) of the scaffold obtained by this technique by tuning the temperature of the extraction process. Figures 3a and 3b show the comparison between the morphology of polymeric scaffolds obtained by the solid-liquid extraction performed in isothermal (T1=-18°C) and non-isothermal (-18°C<T2<25°C) conditions, respectively. Both samples have a regular, homogeneous, and highly porous surface, with pore size being different depending on the preparation conditions. The structures obtained at T1 (Figure 3a) showed a smaller pore size (about 20 μm in diameter) than the sample prepared in non-isothermal conditions (Figure 3b). The insets of Figure 3 show zoomed areas of the scaffold surface. In both cases, pores at the nanometre scale can be observed in the polymeric foam struts. It is evident from this example that it is possible to obtained multiscale architectures of polymer scaffold, with hierarchical porosity that matches the features of native tissue.
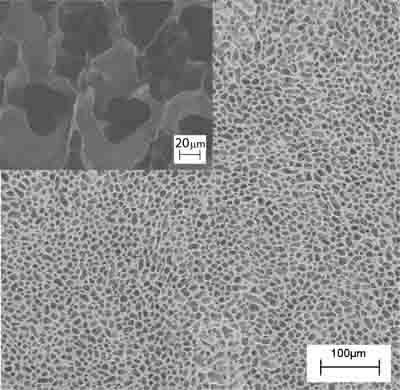
Figure 3a

Figure 3b
Figure 3: SEM images of a poly-L-Lactic acid, PLA, scaffold prepared by the phase separation technique at two different temperature (T) of solvent extraction, (a) T=-18°C and (b) -18°C<T<25°C. The insets show high magnification SEM micrographs of a PLA scaffold prepared by the phase separation technique at two different temperature (T) of solvent extraction, (a) T1=-18°C and (b) -18°C<T2<25°C.
3) Electrospinning is a polymer processing technique that has been revitalized with the advent of tissue engineering. The working principle of the technique consists of applying a high-voltage electric field (of the order of 1÷10 kV) between a metallic capillary containing a desired polymeric solution/melt and a collecting electrode (usually a conductive plate) electrically grounded. When the electrical field overcomes the resistance of the surface tension of the polymeric solution, the electrically charged solution is ejected from the capillary towards the counter electrode. The polymeric jet stretches under the action of the electrostatic force and produces long and thin fibers [11]. In practice, the polymer solution is electrospun from a flat-ended needle of a syringe, whose shaft is actuated by a programmable syringe pump that supplies the solution to the needle and fuels the process. In most of the cases reported in the literature, electrospinning is used to prepare mats of fibers to be used as scaffolds for tissue engineering, with limited control in porosity and therefore in cell adhesion and growth. None the less electrospinning offers the possibility to tune most geometrical and morphological properties on the entire hierarchy of scales of the scaffolds. Thus, besides controlling the fibre diameter, it is possible for example to modify the macro porosity by changing the confluence, the number of layers, or the alignment of the fibres in the network. Micro and nanoporosity may also exist and be controlled. Figure 4 shows electrospun PLLA nanofibers (300÷400 nm in diameter) with characteristic nanopores, whose size can be controlled via process parameters (i.e., applied voltage, electrode distance and configuration, concentration and viscosity of the solution, solution flow rate, etc).
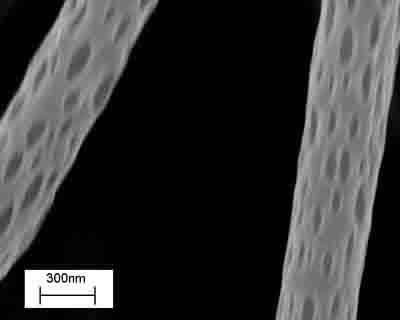
Figure 4
Figure 4. SEM image of poly-L-Lactic acid, PLA, electrospun nanofibers with nanopores.
Electrospinning allows also the control of fibre alignment for the purpose of tuning the macro texturing of the scaffold. In general, if a simple collecting plate (e.g. an aluminium foil) is used, the electrospun fibres deposit randomly, forming a spaghetti-like stack. We devised patterned electrodes to control the achieve fibre alignment. Figure 5 (left) shows the experimental setup used, where two Cu parallel bars were first used as grounded collecting electrodes. Each bar was 50 mm long, with a square cross section 5 mm wide. They were placed 50 mm apart at a distance of about 170 mm from the syringe needle charged at about 20 kV. An auxiliary 180 mm diameter Cu ring was also connected to the generator to stabilize the electric field and control the jet motion. In this configuration, PCL fibers with a diameter of 2÷4 μm electrospan orderly between the Cu bars, rendering the highly oriented bundle (not shown). This result, relevant per se, served as a building block to device scaffold with more complicated patterns. Another experiment was performed with the same experimental set-up but the addition of another pair of Cu bar electrodes placed at 90° from the former, as shown in Figure 5 (bottom-left). The aim was the fabrication of a scaffold made with two groups of fibres oriented along orthogonal directions. Figure 5 (right) shows, indeed that the resulting scaffold exhibited a macroscopic texture with both a short-range ordered plot and periodic features orthogonal to each other. This approach offers a convenient technique to modulate the in-plane elasticity of the scaffold which has been found to be relevant for differentiation of cardiac progenitor cells [12].

Figure 5a
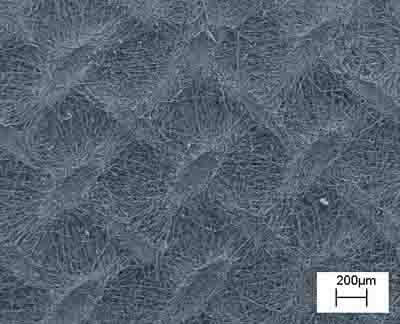
Figure 5b
Figure 5: Schematics of the electrospinning experimental set up (left), where the grounded collecting electrodes were (a) two Cu parallel bars, (b) two pair of Cu bar electrodes placed orthogonal to each others. SEM micrograph of macroscopically textured PCL scaffold from 90° crossing of fiber bundles.
The biological validation of the produced scaffolds was performed in vitro using a murine Lineage negative, Sca-1 positive, mesenchymal stem cell line of bone marrow origin (mMSC) [12]. Cells were seeded on sterilized and equilibrated scaffolds at the concentration of 3X10⁴/cm2. Cell viability and proliferation were tested after 24, 48, and 72 hours. Data showed no significant evidence of cell death with respect to cells grown on chamber slides in standard culture conditions (used as controls). To detect the proliferation ability, cycling cells were calculated as the ratio between the number of mitotic nuclei and total number of fixed and stained nuclei by fluorescence microscope analysis. Data showed that mitotic nuclei number of cells grown on scaffolds increased of 1.5 fold, after 24h and 3 folds, after 48h, similarly to controls. After 72h, no significant number of mitotic nuclei was observed, being cells grown at confluence. The validation was successful for all the scaffolds discussed inhere. For illustrative purpose, Figure 6 shows the immunofluorescence (IF) images of the mMSC seeded on scaffolds shown in Figures 3b. Stem cells were able to colonize the pores created and to adhere functionally to the scaffolds. Indeed adherent cells, decorated with tetra-rhodamine conjugated phalloydine, directed against F-actin, showed a typical elongated shape and well organized stress fibres. The results demonstrated not only the cytocompatibility of the materials used, but also significant adhesion and proliferation of seeded cells onto the constructs.
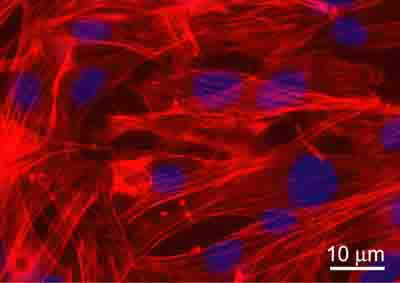
Figure 6
Figure 6: Immunofluorescence analysis of F-actin expression (red) in mMSC grown after 72h, on PLA scaffold from Figure 3b. Nuclei were stained with 4’, 6’-diamidino-2-phenylindole (DAPI). Images of cell samples were taken with a Leica DMRB microscope using a digital camera. The images were representative of at least five random fields for each sample.
Conclusions
The body of the experimental results demonstrated that 3D multiscale polymeric scaffolds for tissue engineering can be pursued with several approaches, each one having a characteristic signature. Porogen leaching (in a lesser extent), phase separation, and electrospinning techniques, all allowed the fabrication of porous scaffolds exhibiting features on different length scales, whose properties can be finely tuned by controlling the process parameters. Changing the size and shape of a target porogen, as well as modifying the temperature profile of a phase separation process, is a low-cost and user-friendly operation, enabling scaffold architecture in a broad range of length scales. Similarly, changing the materials (e.g., polymer, solvent, the composition of the solution) and/or the experimental setup (e.g., applied voltage, electrode distance, electrode pattering) can radically transform the appearance of the fibre network prepared using electrospinning. By means of purposely designed collecting electrodes, it is possible to switch from a totally random macrotexture to an ordered arrangement. Overall, the results demonstrate the applicability of tuneable polymeric scaffolds with hierarchical porosities in cardiac tissue engineering. Adult stem cells adhered and proliferated onto the fabricated constructs, providing the biological validation.
Co-authors of the study
E. Traversa, S. Licoccia, Centro NAST & DSTC, Università di Roma Tor Vergata
B. Mecheri, C. Mandoli, S. Soliman, A.Rinaldi, DSTC Università di Roma Tor Vergata
P. di Nardo, M. Minieri, Centro NAST & Dept. Int. Medicine, Università di Roma Tor Vergata
G. Forte, F. Carotenuto, F. Pagliari, S. Pagliari, Dept. Int. Medicine, Università Roma Tor Vergata
References
[1] R. Langer and J.P. Vacanti. Tissue engineering. Science, 260, 920 (1993).
[2] Y. Cao; J. P. Vacanti; K. T. Paige; J. Upton; C. A. Vacanti. Transplantation of chondrocytes utilising a polymer-cell construct to produce tissue engineered cartilage in the shape of a human ear. Plast Reconstruct Surg, 100, 297 (1997).
[3] K. Nishida, M. Yamato, Y. Hayashida, K. Watanabe, K. Yamamoto, E. Adachi, S. Nagai, A.Kikuchi, N. Maeda, H. Watanabe, T. Okano, and Y. Tano. Corneal Reconstruction with Tissue-Engineered Cell Sheets Composed of Autologous Oral Mucosal Epithelium. N. Eng J. Med. 351,12 (2004).
[4] W.H. Zimmermann, C. Fink, D. Kralisch, U. Remmers, J. Weil, T. Eschenhagen. Three-dimensional engineered heart tissue from neonatal rat cardiac myocytes. Biotechnol. Bioeng., 68, 106 (2000).
[5] Y. Miyahara, N. Nagaya, M. Kataoka, B. Yanagawa1, K. Tanaka, H. Hao, K. Ishino, H. Ishida, T. Shimizu, K. Kangawa, S. Sano, T. Okano, S. Kitamura and H. Mori. Monolayered mesenchymal stem cells repair scarred myocardium after myocardial infarction. Nature Medicine, 12, 459 (2006).
[6] N.N. Malouf, W.B. Coleman, J.W. Grisham, R.A. Lininger, V.J. Madden, M. Sproul, P.A. Anderson. Adult-derived stem cells from the liver become myocytes in the heart in vivo. Am. J. Pathol., 158, 1929 (2001).
[7] R. Fiaccavento, F. Carotenuto, M. Minieri, C. Fantini, G. Forte, A. Carbone, L. Carosella, R. Bei, L. Masuelli, C. Palumbo, A. Modesti, M. Prat, P. Di Nardo. Stem cell activation sustains hereditary hypertrophy in hamster cardiomyopathy. J. Pathol., 205, 397 (2005)
[8] M.M. Stevens and J.H. George. Exploring and Engineering the Cell Surface Interface. Science, 310, 1135 (2005).
[9] E. Palin, H. Liu, and T.J. Webster. Mimicking the nanofeatures of bone increases bone-forming cell adhesion and proliferation. Nanotechnology, 16, 1828 (2005).
[10] E. Traversa, B. Mecheri, C. Mandoli, S. Soliman, A. Rinaldi, S. Licoccia, G. Forte, F. Pagliari, S. Pagliari, F. Carotenuto, M. Minieri, P. Di Nardo. Tuning Hierarchical Architecture of 3D Polymeric Scaffolds for Cardiac Tissue Engineering. Journal of Experimental Nanoscience, in press 2007
[11] L. Dan, X. Younan. Electrospinning of nanofibers: reinverting the wheel?. Adv. Mater., 16, 1151 (2004).
[12] G.Forte, F. Carotenuto, F. Pagliari, S. Pagliari, P. Cossa, R. Fiaccavento, A. Ahluwalia, G. Vozzi, B. Vinci, A. Serafino, A. Rinaldi, E. Traversa, L. Carosella, M. Minieri, P. Di Nardo. Polymeric scaffold guidance to stem cell differentiation and tissue warping. Nature Materials, (submitted September 2007).
Related Information
Prof. E. Traversa
Tissue-Specific Stem Cells
Nanocomposites Electrolytes for Intermediate Temperature Polymer Electrolyte Fuel Cells
Among the possible systems investigated for energy production with low environmental impact, fuel cells are very promising as electrochemical power sources both for stationary energy production and application in portable technology and electric vehicles. Polymeric electrolyte membrane fuel cells (PEMFCs) are the most promising candidates for the latter application.
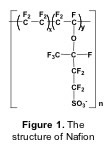
The material most widely used forelectrolyte membranes is Nafion, a perfluorinated sulfonated polymer (Figure 1). Because of its water assisted conduction mechanism, Nafion can be used only at temperatures below 100 °C [1]. For practical applications, however, operating PEMFCs at higher temperature is desired, both for hydrogen and methanol-fuelled cells. When hydrogen is used as a fuel, an increase in the cell temperature above 100°C produces enhanced CO tolerance, faster reaction kinetics, easier water management, and reduced heat exchanger requirement. The use of methanol as a fuel for vehicles has several practical benefits such as easy transport and storage, but the slow oxidation kinetics of methanol and its crossover through the membrane reduce the efficiency of direct methanol fuel cells (DMFCs). Therefore, increasing the operation temperature of proton conducting membranes is a key issue in the development of PEMFC technology [2,3].
 The strategy followed by researchers of NAST Centre is to develop organic/inorganic hybrid membranes in order to achieve the goal of obtaining PEMs capable to operate at temperatures up to and above 120°C . Organic/inorganic hybrids are investigated for a variety of applications, ranging from optics to electronics, to sensors and many others, since they offer the possibility to combine the properties of the two components in a unique material [4]. Thus, we have studied nanocomposites where inorganic materials were added to a polymeric matrix, either of Nafion or of totally aromatic sulfonated polymers. In the case of polymeric electrolytes, the addition of nanocrystalline oxides is effective in improving ionic conductivity, mechanical strength, and thermal stability [5]. Since performance is strongly influenced by the filler particle size, we developed a simple and versatile route for the preparation of ceramic oxides with nanometric grain size [6]. MxOy (M = Ti, Nb, In and Zr) were synthesized by rapid hydrolysis of an alcoholic solution of metal alkoxides. The preparative conditions were optimized to enhance the reaction kinetics leading to fast nucleation and favoring the formation of nanoparticles. Figure 2 shows the TEM micrograph of TiO2 (chosen as a representative example) obtained by thermal treatment of the sol-gel precursor at 500°C. The particle size was in agreement with the XRD measurements (12 nm), although the presence of aggregates was determined. The in-house prepared nanocrystalline titania was used as a filler in the preparation of Nafion based composite membranes to be used as electrolytes in PEMFCs, with the aim of increasing the operation temperature. The electrochemical performance of such membranes was investigated both in methanol and hydrogen fuelled fuel cells.
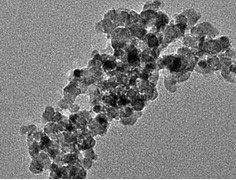
Figure 2. TEM micrograph of sol-gel derived Titania calcined at 500°C.
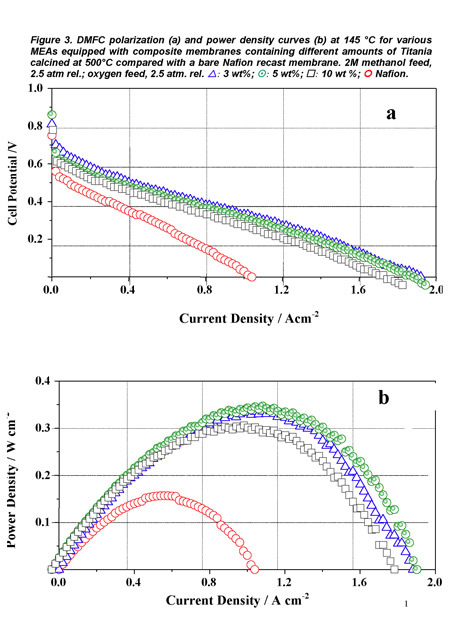
All the Membrane Electrode Assemblies (MEAs) prepared with the membranes of different composition were capable to operate in a DMFC up to 145°C, a temperature much higher than that reached by a bare Nafion recast membrane.
Figure 3 shows, again as a representative example, the polarization (a) and power density (b) curves obtained for the DMFC prepared with such MEAs with a 2 M methanol solution feed at the anode, and using oxygen as oxidant. A maximum power density of 350 mW cm-2 was reached at a current density of about 1.1 A cm-2 with the membrane containing 5 wt% TiO2. Moreover, the cell was subjected to a one month cycled operation (6 hours per day including start up and shut down procedures) without significant performance decrease. The presence of the fillers contributed to stabilize the polymer morphology at high temperature and inhibited the direct permeation of reaction gases by modifying the transport pathways [7].
 Operation at temperatures above 100°C is needed also for hydrogen-fuelled polymer electrolyte fuel cells, both for direct hydrogen (DH-PEFC) and processed hydrogen (PH-PEFC) cells, to enhance reaction kinetics, reduce heat-exchange requirements and, in PH-PEFC, increase CO tolerance. We have thus studied the electrochemical performance of a Nafion based composite membrane, containing 3 wt% nanometric TiO2 calcined at 400°C [8].
Table I summarizes the water uptake and ion exchange capacity (IEC) of the nanocomposite membrane compared with the values relative to a pure Nafion recast membrane prepared in the same experimental conditions and a commercial Nafion 115 membrane. The water uptake and ion exchange capacity of the composite membrane were significantly higher than those determined for the reference pure Nafion recast membrane, while commercial Nafion 115 gave intermediate values
Table I
Water uptake and ion exchange capacity data for different Nafion-based membranes.
| Membrane |
Water uptake (%) |
IEC (meq/g) |
| Nafion 115 |
27 |
0.91 |
| Nafion recast |
20 | 0.89 |
| Nafion-TiO2 |
29 |
0.93 |
The proton conductivity of the membranes was examined in the temperature range from 80°C to 130°C. The conductivity was always higher for the composite membrane, reaching a value of 0.18 S/cm at 130°C. The commercial Nafion 115 and the composite membrane were tested in DH-PEFC, in a single cell, in humidified H2/air, between 80°C and 130 °C. In the whole temperature range tested, the best performance was obtained with the composite membrane. Figure 4 shows the polarization and power
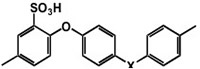
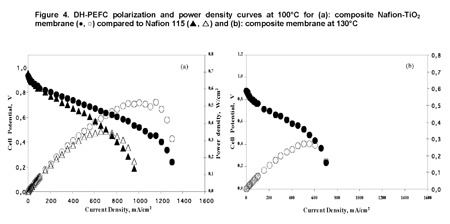 Arylene main chain polymers have receive a great deal of attention as possible alternative to perfluorinated systems mainly because of their lower cost and their ease of functionalization [9,10]. Among the different polymers, we focused our attention on sulfonated polyetheretherketone (SPEEK, Figure 6).density curves obtained for the two membranes at 100°C and those relative to the nanocomposite membrane at 130°C. A power density of 0.514 mW cm-2 was recorded for the composite membrane versus 0.354 mW cm-2 obtained with Nafion 115 at 0.56 V and 110 °C. Most important is to notice that while the pure Nafion membrane was damaged at temperatures above 100°C, the composite membrane continued to operate up to 130°C reaching a power density of 0.254 mW cm-2 at 0.5 V. Tests were also carried out in a PH-PEFC. The cell was fed with steam reforming synthetic fuel (SR: 10 ppm CO; 20% CO2; 75% H2; 1% CH4). Figure 5 shows a comparison between polarization curves at 110°C in pure hydrogen and SR for the nanocomposite membrane. For both fuels, the measured OCV values were good, almost reaching 1 V. A power density value of about 182 mW cm-2 at 0.6 V in synthetic fuel, versus the 366 mW cm-2 value measured in pure hydrogen, was obtained.
 Although the performance for tested MEA fed with SR is lower by about 50% if compared to the performance in pure hydrogen, it is reasonable to assume that the use of suitable electrodes containing Pt-Ru as an electro-catalyst would minimize such loss. Nevertheless, it appeared evident that the filler exerts a beneficial effect in allowing operation at T > 100 °C even in SR fuel.
Figure 6 The structure of sulfonated Poly Ether Ether Ketone (SPEEK)
 Even if at high degree of sulfonation (DS), its conductivity is large enough to meet the requirements needed for application in PEMFCs, its mechanical properties tend to progressively deteriorate with sulfonation because of the absence of significant hydrophilic-hydrophobic separation that results in very narrow and poorly connected water channels and large separation between the sulfonic acid groups [10,11]. To attain the correct balance between the hydrophilic and hydrophobic components we prepared nancomposite membranes containing hydrated tin oxide, a filler that is proton conducting in its own right and to decrease the polymer DS.
The procedure used to synthesize SnO2 x 1.5H2O allowed to obtain nanosized particles. Figure 7 shows the typical SEM micrograph of the as prepared SnO2 x n(H2O) powder. As typical morphology for hydrated compounds, the powder was made of soft agglomerates. Numerous SEM observations allowed to measure the unit particles in the nanometric size range (5-15 nm). Such a small particle size is expected to ease the formation of homogeneous composite membranes.
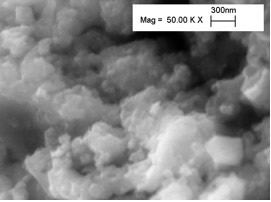
Figure 7. SEM micrograph of the as-prepared SnO2 x nH2O powder.
Figure 8 shows the Arrhenius plots of the conductivity of the composite membranes and of the unfilled SPEEK reference membrane. In the region between 25°C and 75°C, the proton conductivity (σ) values of the composite membrane were always larger than the values measured for the unfilled SPEEK membrane. In particular, at 25°C, σ of the composite membrane was one order of magnitude larger than the σ of the unfilled SPEEK (composite: 0.016 S cm-1; unfilled SPEEK 0.0017 S cm-1). This difference decreased with increasing the temperature and eventually was null at 75°C. The λ values (the number of water molecules per sulfonic acid group of SPEEK) was calculated on the basis of water uptake measurements and considering an additive behavior of the components.
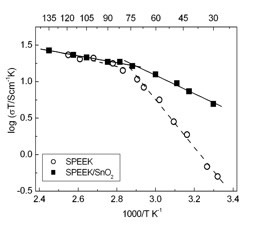
Figure 8. Arrhenius plots of the unfilled SPEEK and SPEEK/SnO2 composite membranes at 100% RH.
In agreement with electrochemical data, λ of the composite membrane was larger than the λ value of the SPEEK membrane below 60°C, temperature at which the λ values of the two samples became the same.
The overall reduced swelling of the composite membrane can be explained assuming that the filler induces morphological modification of the membrane and that the oxide hydration water molecules generate a connection between the polymer sulfonic acid moieties, creating different hydrophilic paths that favor proton transfer [12]. The effect becomes negligible at higher temperature when a decrease in the interactions between polymer chains is known to favor a greater hydration of the polymer [13]. The reduced swelling and higher morphological stability of the composite resulted also in improved membrane performance in terms of durability.
The electrochemical performance of the membranes was tested in a home-made prototype DMFC single cell (Figure 9), acquiring polarization curves.
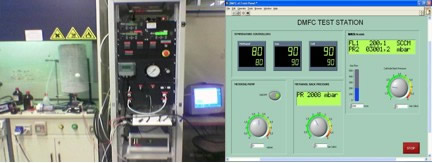 Figure 9. The H2 and CH3OH fuelled Fuel Cell built at Tor Vergata.
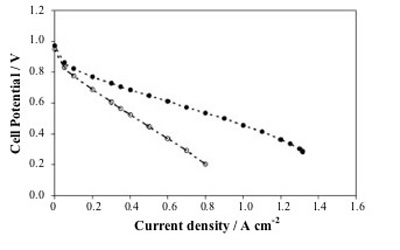
Figure 10 shows the polarization and power curves for the SPEEK/SnO2 composite membrane in a DMFC test at 100 °C, compared with a recast Nafion membrane. As already mentioned, Nafion is the most widely used electrolyte for DMFCs, even though it exhibits high methanol permeation rate as well as a drop in proton conductivity at temperatures larger than 80°C. The I-V curves clearly showed the improved performance of the composite membrane with respect to the Nafion membrane. The open circuit voltage (OCV) for the composite membrane (0.70 V) was larger than that of unfilled SPEEK (0.65 V) and reference Nafion (0.59 V). The polarization curve of the unfilled SPEEK membrane is not shown due to its lower stability in terms of proton conductivity as a function of time. This finding shows that the use of a SPEEK membrane allowed to reduce the methanol crossover with respect to Nafion. Moreover, the presence of tin oxide allowed a further reduction of the methanol crossover.
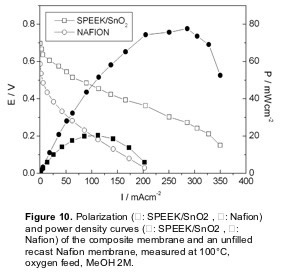 In the whole voltage range investigated, the current values of the SPEEK/SnO2 membrane were always larger than the values obtained with the Nafion membrane. In particular, the composite membrane reached a maximum current density value of 350 mAcm-2 (with respect to 200 mAcm-2 for unfilled Nafion). The maximum power density value reached at 100°C with the composite membrane was 80 mWcm-2 at a current density of about 300 m A cm-2, whereas the maximum power density value of the reference unfilled Nafion membrane at the same temperature was 20 mWcm-2, at a current density of about 120 mAcm-2. The improvement of the polarization curve of the SPEEK/SnO2 composite membrane reflected the drop in conductivity of the unfilled Nafion membrane above 90°C and the enhanced stability of the composite membrane at 100°C.
These results converge to indicate that filling SPEEK membranes with hydrated tin oxide allowed to improve the membrane stability, as well as to decrease its methanol permeability. These features led to an enhancement of cell performance of the composite membrane with respect to our reference Nafion recast membrane, pointing out that SPEEK/SnO2 membrane is a promising electrolyte for DMFCs.
Conclusions
The use of organic/inorganic hybrid membranes has been demonstrated to be effective in achieving good electrochemical performance of PEMFCs at temperatures above 120°C, fed either with processed hydrogen, steam-reformed hydrogen, and methanol.
This research represents some of the results of collaborative efforts of different Italian and foreign Institutions under the framework of MiUR-FISR, MAE-Joint Laboratory and EU-Coordinative Action Projects.
Co-authors of the study
S. Licoccia, E. Traversa Centro NAST & DSTC, Università di Roma Tor Vergata
A. D’Epifanio, C. D’Ottavi B. Mecheri, R. Polini DSTC Università di Roma Tor Vergata
P. Antonucci Univ. Mediterranea of Reggio Calabria
V. Antonucci, A. S. Aricò, E. Passalacqua V. Baglio, A. Carbone, A. Di Blasi, A. Saccà, R. Ornelas CNR-TAE Messina
References
[1] K. A. Mauritz, R. B. Moore, Chem. Rev. 104 (2004) 4535.
[2] M. A. Hickner, H. Ghassemi, Y. S. Kim, B. R. Einsla, J. E. McGrath, Chem. Rev. 104 (2004) 4587.
[3] C. Wieser, Fuel Cells 4 (2004) 245.
[4] C. Sanchez, G. J. De A.A. Soler-Illia, F. Ribot, D. Grosso, C. R. Chimie 6 (2003) 1131.
[5] S. Licoccia, E. Traversa, in: H.-J. Fecht, M. Werner (Eds.) The Nano-Micro Interface: Bridging the Micro and Nano Worlds Together, Wiley-VCH Verlag, Weinheim, 2004, pp.289-301.
[6] S. Licoccia, R. Polini, C. D’Ottavi, F. Serraino Fiory, M.L. Di Vona, E. Traversa, J. Nanosci. Nanotechnol. 5 (2005) 592.
[7] D. J. Jones, J. Rozière, in W. Weslich, A. Lamm, H. A. Gasteiger (eds.), Handbook of Fuel Cells, Fundamental Technology and Applications, vol. 3, Wiley, 2003, pp. 447-455.
[8] A. Saccà, A. Carbone, E. Passalacqua, A. D’Epifanio, S. Licoccia, E. Traversa, E. Sala, F. Traini, R. Ornelas, J. Power Sources (2005) in press.
[9] B. Mecheri, A. D’Epifanio, E. Traversa, S. Licoccia, J. Power Sources, 169 (2007) 247–252
[10] P. Krishnan, J. Park, T. Yang, W. Lee, C. Kim, J. Power Sources, 163 (2006) 2-8
[11] M. Cappadonia, J. W. Erning, S. M. S. Niaki, U. Stimming, Solid State Ionics, 77 (1995) 65-69
[12] V. Ramani, H. R. Kunz, J. M. Fenton, J. Membr. Sci., 232 (2004) 31–44
[13] D. J. Jones, J. Rozière, Ann. Rev. Mater. Res. 33 (2003)
Related Information
Prof. S. Licoccia
NUME, CARISMA, CNR-TAE,
Università Mediterranea Reggio Calabria,
RCAST Tokyo, Università di Roma Tor Vergata
Wetting Layer erosion during formation of InAs/GaAs(001) Quantum Dots
One of the puzzling aspects of the self-assembled QDs is that the nucleated 3D volume is far larger than that being deposited in the narrow coverage range where the entire nucleation process is completed. Resercher from NAST Centre have studied a peculiar feature, recently discovered [1], at the origin of this phenomenon, which is associated with mature 3D QDs,
i.e. the erosion of the step edge surrounding dots. This is clearly shown in Figure 1 which compares two areas of the surface of InAs, with coverage 1.54 ML (panel (a)) and 1.61 ML (panel (b)), where the average volume of the 3D-QDs amounts to 220 nm3 and 340 nm3, respectively. QDs are observed nucleating preferentially at the upper side of the step edges, as shown in panel (a). Comparing images for successive coverages one observes that QDs close to the step edge (A in panel (a)) progressively erode the step edge (B) until they appear detached (C in panel (b)), as shown in the schematic pictures A-D below the topographies. Such erosion is evident for dots over the step edges but is unclear for dots nucleated on flat areas of the surface. Nevertheless, signs of erosion of the surface plane surrounding dots (QDs labeled “D” in panel (c)) were observed for growths at higher temperature 522°C and coverages (2.4 ML). In the last case the larger size of the dot (average volume 1500 nm3) and, consequently, the larger strain energy at its base, could account for the erosion. However, even at 500°C a reduced plane-erosion cannot be excluded because of the finite tip resolution.
As for other systems [2-5], substrate erosion may be favored in this case by the In-Ga intermixing which draws material from the substrate to create the alloyed island. This interpretation is supported by the work of Cullis et al. [6] on InxGa1-xAs/GaAs, which predicts, for x=1, the largest elastic energy-per-atom and the highest In concentration in the upper layers of the QDs [6-8].
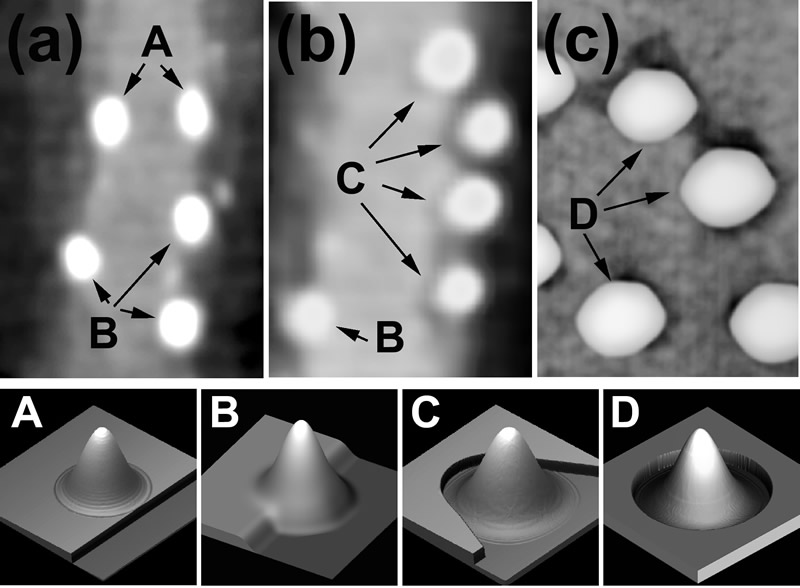
Figure 1. 120×160 nm2 AFM images for coverages of 1.54 ML (a) and 1.61 ML (b). “A” are QDs nucleated over the step edge, “B” are QDs that have partially eroded the step edge, and “C” are QDs that have completely eroded it. (c) 80×120 nm2 AFM image showing plane erosion occurring for 2.4 ML InAs growth at 522°C (“D” are QDs after erosion). The bottom panels show schematic 3D views of QDs before and after the step or plane erosion [1].
Around the QD, a compressive strained area forms where the elastic energy differs from that of the WL far from the island by an amount that is large and positive; inside the dot, instead, it is negative [9]. The minimum value is due to the partial strain relaxation inside the dot; the maximum, at the periphery, is due to the strain propagation along the interface which increases the misfit between the underlying substrate and the WL encircling the dot. We speculate that, because of this strain profile, the detachment rate of adatom from steps is higher than the attachment rate, favoring the consumption of the step.
In Figure 2 the total dot volume is plotted as a function of the evaporated In amount. Fig. 2 highlights the increase of the dot volume in the 2D-3D transition region for Continuous Growth (CG), Growth Interrupted (GI) and Growth Interrupted on very flat samples (GI-flat). This increase is well beyond the volume of the material being deposited (straight line in the figure). Two regions with different slopes can be distinguished: in the range 1.6-1.8 ML, the dependence of the dot volume on coverage is linear with slope Ft ≈ F0 for all the samples, where F0 is the slope of straight line representing the volume being deposited by the impinging InAs flux. Above 1.8 ML, the volume increases at the same rate F0 of the coverage. It is worth underlining that this volume behavior is a clear evidence of the large surface mass transport from the 2D to the 3D phase at the very initial stage of the transition. This can be quantified Δθ=0.9 ML for the CG and GI samples, and Δθ =0.5 ML for the GI-flat. Such mass transfer ends at 1.8 ML, above which volume increases solely at the expense of the incoming flux. The ensuing discussion concerns the microscopic origin of the excess volume. AFM topographies allow for a lower estimate of the amount of eroded material around islands, ΔV=0.3 ML [1] sets a lower limit to the surface mass current due to erosion.
 Figure 2: QDs volume plotted as a function of InAs coverage for the CG, GI and GI-flat samples. The lowest straight curve indicates the InAs flux above the 2D-3D transition
Therefore, in addition to surface segregation and substrate intermixing, a relevant fraction of the dot volume comes from step erosion; not enough, however, to account for all the 3D volume in excess. A further contribution can be accounted to floating In atoms observed at the very beginning of nucleation [10,11]. A good input comes from the comparison of the total QDs volume in the CG, GI and GI-flat samples [12], shown in Figure 2. While for the CG and GI samples the excess volume ΔθCG, ΔθGI≈0.9 ML, for the GI-flat ΔθGI-flat≈0.5 ML, thus suggesting an erosion dependence by the initial wetting layer morphology. This finding is still more interesting if compared with the step density per unit area for all the samples analyzed. Just before the transition starts, the CG and GI surfaces present a value of density of steps ρCG= ρGI =23μm-1, while for the GI-flat is ρGI-flat= μm-1. The relation between the step density and the excess volume is thus apparent: in particular, if we notice that the ratio ρGI-flat/ρCG is similar to ΔθGI-flat /ΔθCG and that the step erosion occurs with the same intensity for each sample, we infer that large part of the excess volume has likely to be accounted by step erosion (and, in general, by wetting layer erosion). Such interpretation is strengthened by the disappearance of 2D islands during the large QDs density explosion, i.e. when step erosion is operating.
The origin of the transition between the two families of QDs can be understood if we consider the evolution, as a function of coverage, of the total volume contained in large QDs only. Above 1.8 ML, the QDs excess volume increase reverts to being compatible with F0. The extra quantity of matter amounts to roughly 0.9 ML. We have set a lower limit for erosion to 0.3 ML. Even though the erosion could be responsible for the whole supplementary 0.9 ML, a further contribution could arise from substrate intermixing and In segregation [10].
References
[1] E. Placidi, F. Arciprete, V. Sessi, M. Fanfoni, F. Patella and A. Balzarotti, Appl. Phys. Lett. 86, 241913 (2005)
[2] W. Seifert, N. Carlsson, J. Johansson, M. Pistol and L. Samuelson, J. Cryst. Growth 170, 39 (1997)
[3] X.Z. Liao, J. Zou, D.J.H. Cockayne, Z.M. Jiang, X. Wang and R. Leon, Appl. Phys. Lett. 77, 1304 (2000)
[4] S.A. Chaparro, Y. Zhang and J. Drucker, Appl. Phys. Lett. 76, 3534 (2000)
[5] N. Motta, J. Phys. Cond. Matter 14, 8353 (2002)
[6] T. Walther, A.G. Cullis,D.J. Norris, M. and Hopkinson Phys. Rev. Lett. 86, 2381 (2001)
[7] A. G. Cullis , D. J. Norris , T. Walther, M. A. Migliorato and M. Hopkinson Phys. Rev. B 66, 081305 (2002)
[8] A.G. Cullis, D.J. Norris, M.A. Migliorato, M. Hopkinson, Appl. Surf. Sci. 244, 65 (2005)
[9] A.L. Barabàsi, Appl. Phys. Lett. 70, 2565 (1997)
[10] F. Patella, M. Fanfoni, F. Arciprete, S. Nufris, E. Placidi, and A. Balzarotti, Appl. Phys. Lett. 78, 320 (2001)
[11] H. Tsuyoshi, S. Tsukamoto, and Y. Arakawa, Jap. J. Appl. Phys. 45, L777 (2006)
[12] E. Placidi, F. Arciprete, F. Patella, M. Fanfoni, E. Orsini and A. Balzarotti, J. Phys. Cond. Mat. 19, 225006 (2007)
Related Information
Prof. F. Patella
InAs/GaAs(001)
Ultra-high dense growth of germanium nanodots on SiO2 thin films
The use of self-organization phenomena at semiconducting surfaces allows fabricating quantum dot structures for producing novel nanodevices with unprecedented applications not only in optoelectronics, but also for room temperature operating single electron transistors and/or resonant tunneling structures. Fabrication of ultra-dense Ge dots on silicon surfaces still presents a series of problems far to be completly manageable, thus limiting their density to values between 109 and 1010 cm-2. Ge islands growth on SiO2 films, occurring through a Volmer-Weber mechanism, allows well higher dots density. This work present the growth of crystalline Ge nanostructures with average dot size of (5 ± 1) nm and very high dot density of about 2.8 x 1012 cm-2. Ge dots appear almost flat with a beginning of faceting and characterized by a low aspect ratio. Furthermore from the I-V curves we measured an energy gap of about 1.8 eV that is well wider than that of Ge bulk thus indicating the occurrence of a quantum confinement effect. After SiO2 3.0 nm thick film cleaning, growth of Ge dots have been obtained by following a two steps process. First, four monolayers (MLs) of Ge have been deposited on the SiO2 clean surface kept at room temperature (RT), then the sample has been in-situ annealed at 500oC for 30 minutes. The STM image of the clean SiO2 surface nicely mimics the shape of Si(001) underneath surface resulting in a perfect sequence of terraces 70 nm wide and monoatomic steps with a roughness of 0.06 nm (shown in Figure 1 a)). On terraces we observed small isolated white spots, with a density of about 1×1013 cm-2, forming a highly defected substrate. After 4 ML Ge deposition at room temperature, the STM image showed a complete coverage of the SiO2 surface and randomly distributed, strictly interconnected Ge amorphous clusters with a density of about 3.8 x 1012 cm-2 ( shown in Fig.1 b)). The subsequent heating at 500oC changed the surface morphology giving rise to individually separated Ge dots, with a density of 2.8×1012 cm-2 (Figure 1 c)). The Ge dots average lateral size is (5 ± 1) nm. Statistical analysis, carried out on more than one hundred islands, leads to an aspect ratio of (0.17±0.04), a value lower than all those reported in literature for similar coverages.
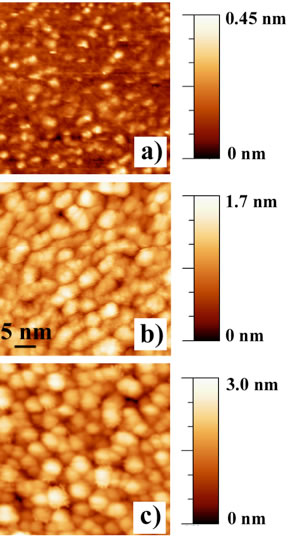
Figure 1
Figure 1- a) STM image of the SiO2 substrate. Vsample = -3.0 V, I = 0.5 nA b) STM image of 4 MLs of Ge deposited on SiO2/Si(001) surface kept at room temperature. V sample = 2.0 V, I = 1.0 nA; c) STM image of the sample shown in the panel b) after annealing at 500oC for 30 min. V sample =3.0 V, I = 0.5 nA. Gray-scale ranges (at left) confirm the sizeable changes in the RMS roughness values passing from the bare SiO2 substrate to the amorphous deposited Ge film and the Ge dots.
An important point of debate is the shape of these dots, generally reported to be hemispherical. By making a careful study based on the surface gradient analysis of the shape of the Ge dots we found that they appear almost flat with beginning of faceting along the {113} planes. Interestingly, the Ge dots are completely not oxidized after the heating procedure as measured by the XPS spectra. This also suggests that no bonds involving Ge atoms and SiO2 substrate are formed at the interface. On the other hand, it is worth noting that the total volume of Ge dots is approximately the same than the volume of the deposited Ge layers. This means that there is neither formation of a wetting layer, nor Ge atoms desorption during the thermal treatment, nor intermixing between Si and Ge atoms. These XPS results, as well as those of the surface gradient analysis, indicate that SiO2 film always isolates Ge dots from the Si bare substrate. Another interesting aspect to investigate is the electronic behaviour of these nanostructures. The I-V and the conductance curves recorded on the Ge dots have been compared to that obtained for a Ge nominal deposition of 5 MLs characterized by Ge dots with an average lateral size of about 50 nm. Our results show that by reducing the cluster size, there is a significant reduction of the conductance thus meaning that the energy bandgap increases from approximately 0.7 eV to 1.8 eV. This is a hint that energy bandgap widening is an intrinsic property of the Ge dots induced by quantum confinement that changes significantly their electronic band structure.
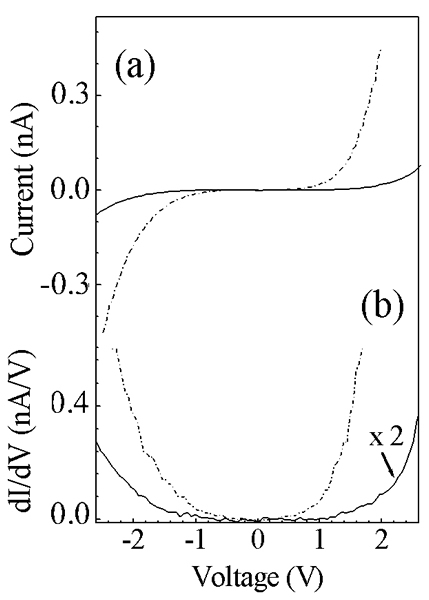
Figure 2
Figure 2 – I-V (a) and conductance (b) curves for the 4 MLs of Ge deposited on SiO2/Si(001) surface kept at room temperature and annealed at 500oC for 30 minutes (solid lines) and for a 35 MLs nominal Ge deposition (dot dashed lines).
The direct measurement of this gap is important because it can be related to the room temperature photoluminescence (PL) feature observed in case of Ge dots. This PL signal has been generally observed for Ge dots embedded or deposited on SiO2 and in the past was interpreted as due to recombination through radiative states at the Ge/SiO2 interfaces. Our I-V measurement pointed out that the PL peak can be not only attributed to the recombination through radiative states at the Ge/SiO2 interfaces but also to a genuine quantum confinement effect. In conclusion, isolated, almost flat, nonepitaxial and not oxidised Ge dots with an average lateral size of approximately 5 nm, a low aspect ratio and a density of 2.8 x 1012 cm-2 have been grown. They show a semiconducting behaviour with a value of the energy gap well wider than that of Ge bulk, to be ascribed to their reduced size. The high density together with the observation of the widening of the energy gap makes the Ge islands on SiO2 very promising for application in optoelectronics.
Reference
I. Berbezier, A. Karmous, A. Ronda, A. Sgarlata, A. Balzarotti, P. Castrucci, M. Scarselli, M. De Crescenzi, Applied Physics Letters 89, 063122 (2006) paper selected to appear on Virtual Journal of Nanoscale Science & Technology, Volume 14, issue 9, (2006)
Experimental team
A. Sgarlata, A. Balzarotti, P. Castrucci, M. Scarselli, M. De Crescenzi , NAST Centre
I. Berbezier, A. Karmous, A. Ronda, L2MP UMR CNRS 6137, Polytech Marseille-Technopole de Château Gombert, 13451 Marseille, France
Related Information
Prof. M. De Crescenzi
Virtual Journal of Nanoscale Science & Technology
Nanoengineered silica nanoparticles as intracellular nanoprobes
Nanotechnology is the science of manipulating matter at the atomic and molecular level to obtain materials with specifically enhanced chemical and physical properties. Collaborative research among scientists from Italy – the Nast Centre for Nanoscience Nanotechnology and Innovative Instrumentation, are working in the emerging challanging field of nanomedicine (the preservation and improvement of human health using the tools and knowledge of nanotechnology) may permit the development of more effective means for diagnosing and treating malignancies compared to the currently used small molecules. To enhance diagnostic or therapeutic efficacy, novel nanoassemblies must be engineered to function in biologically relevant environments and have multivalent loading capacity for easy detection or effective drug delivery. In the past decade, several types of nanoparticles have been prepared and evaluated for tissue targeting, sensing and imaging, and localized therapy (Akerman et al., 2002, Bottini et al., 2006). Often, the chemistry of these nanoparticles has limited their stepwise assembly into multilayered systems and capacity to interact multivalently with cell membrane receptors. Silica nanoparticles (SNP) have been widely used for biosensing and catalytic applications due to their large surface area to volume ratio, straightforward manufacture and the possibility to be doped and/or functionalized with fluorescent molecules (Bottini et al., 2006), magnetic nanoparticles (Wang et al., 2005) or semiconducting nanocrystals (Lin et al., 2006). SNP can be prepared using several techniques, including the widely used Stobër technique and the water-in-oil nanoemulsion system. The former is based on the simple hydrolysis of a silica precursor in alcoholic medium in the presence of ammonia; the latter uses water droplets inside of reverse micelles as nanoreactors. The size of the final nanospheres is mainly regulated by the dimension of the water droplets and, therefore, by the molar ratio of water to surfactant and by the molar ratio of water to the precursor. Other relevant parameters are the molar ratio of the precursor to the catalyst, the reactivity of the precursor, the total time and temperature of the reaction. Quantum dots (QD) are colloidal semiconducting nanocrystals a few nanometers in diameter, and are typically coated with functional polymers that permit the tethering of various small and macro-molecules resulting in aqueous environment compatibility. Because of their small size, their energy levels are quantized so that photon energy emission is restricted to a narrow range after broad range absorption. Their adherence to quantum behavior makes them superior to small organic fluorescent molecules that bleach rapidly after excitation only in a narrow absorption range. Therefore, QD represent an excellent building block for the realization of intracellular nanoprobes and delivery systems. However, QD have shown signs of toxicity dependent on several factors like dose, dimension and chemical functionalization (Hardman, 2006). Moreover their solubilization under physiological conditions and superficial funzionalization are not straightforward. Encapsulation of QD into SNP could increase their wettability and decrease the cytotoxic effects (Zhang et al., 2006). Moreover specific functional groups can be easily introduced on the silica surface reducing aggregation and allowing further functionalization to realize nanoengineered nanoassemblies (Bag-we et al., 2006). In this report we describe the realization and characterization of SNP doped with QD and decorated with neutravidin (Nav). To demonstrate that this luminescent nanoassembly could be further functionalized with either small or macromolecules, we coated the surface with biotilynated mouse anti-human CD3 (αCD3), exploiting the strong affinity between biotin and Nav, and we investigated their delivery into Jurkat T cells through CD3 receptor-mediated endocytosis. As such, the realized nanoassembly represents a potentially excellent scaffold for constructing intracellular multivalent nanoprobes.
MATERIALS AND METHODS
Materials
Unless otherwise noted, all reagent-grade chemicals were used as received, and Millipore water was used in the preparation of all aqueous solutions. Cyclohexane, Triton X-100, n-hexanol, tetramethyl orthosilicate (tmos), aminopropyl trimethoxysilane (apts), trihydroxysilyl propylmethylphosphonate (thpmp), ammonia (28% in water), poly-L-lysine, formaldehyde, dimethyl formamide (DMF), Triton X- 100 and PBS were purchased from Sigma-Aldrich (St. Louis, MO). ZnS-covered CdSe QDs from Evident Technologies, Inc. (Troy, NY) were capped by trioctylphosphine oxide (TOPO) had 542-nm emission wavelengths and diameter of approximately 2 nm. Water-soluble biotin labeling reagents with spacer arm (sulfo-NHS-LC-biotin) and Nav were purchased from Pierce Biotechnology, Inc. (Rockford, IL). Biotinylated and unconjugated αCD3 were from eBioscience, Inc. (San Diego, CA); rabbit anti-human CD107A (LAMP-1) antibody was received from Prof. Fukuda laboratory (Burnham Institute for Medical Research, La Jolla, CA). Texas Red-labeled goat anti-rabbit antibody and Texas Red-labeled concanavalin A were from Molecular Probes (Invitrogen Corp., Carlsbad, CA); normal mouse serum (NMS) was from Santa Cruz Biotechnology (Santa Cruz, CA); normal goat serum (NGS) was from Gibco (Invitrogen Corp., Carlsbad, CA); fetal bovine serum (FBS) was from Tissue Culture Biologicals (Informagen, Inc., Newington, NH); RPMI-1640 cell culture medium and Dulbecco’s modified Eagle’s medium-high glucose (DMEM-HG) were from Cellgro (Mediatech, Inc., Herndon, VA).
Realization quantum dot-doped silica nanoparticles decorated with neutravidin
A cyclohexane, Triton X-100 and n-hexanol mixture (volume ratio 4.2:1:1; the final volume of the mixture was 24.8 ml) was converted to a nanoemulsion by stirring at room temperature for 1h. Water (940 μl) and tmos (100.5 μl) were added. Sonication for 1 h was performed to facilitate the diffusion of tmos into the encapsulated water droplets in the nanoemulsion. A drop (59 μl) of ammonia was added to catalyze the hydrolysis of tmos and condensation.
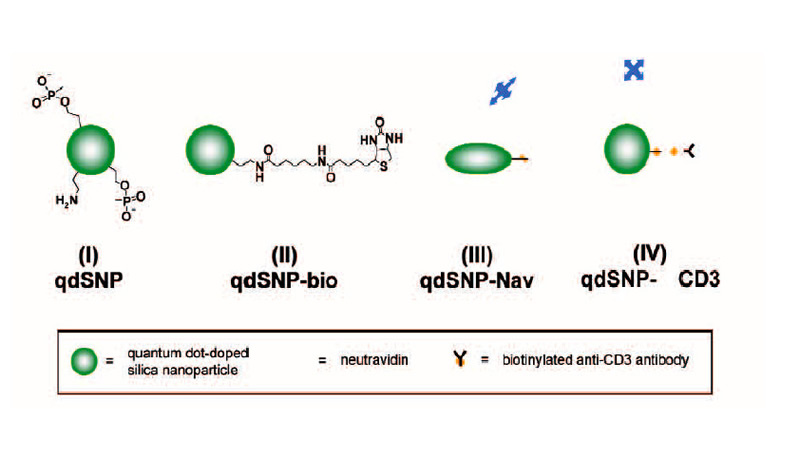
Scheme 1 – Quantum dot-doped silica nanoparticles (I) functionalized with amino and phosphonate groups, (II) after the coupling of the amino groups to biotin labeling reagents with spacer arm, (III) decorated with neutravidin and (IV) after incubation with biotilynated mouse anti-human CD3.
The mixture was stirred for 30 min, and then 25 nmoles of QD in toluene were added. The reaction mixture was stirred for 24 h, followed by the addition of tmos (10.05 μl), and a mixture of apts (5.9 μl) and thpmp (15.1 μl). The time interval between the addition of tmos and the mixture of organosilanes was at least 30 min. The mixture was further stirred for 24 h, and then the quantum dot-doped SNPs (qdSNP) were precipitated by addition of acetone (25 ml) and washed several times with water then anhydrous ethanol (scheme 1(I)). 1 mg of qdSNP were stirred for 2 hours in phosphate saline buffered (PBS) solution in presence of 30 mg of sulfo-NHS-LC-biotin and then washed 3 times with PBS (qdSNP-bio, scheme 1(II)). qdSNP-bio were incubated with 5 mg of neutravidin overnight and then washed with PBS until the absorbance of the collected supernatant revealed the total absence of free protein (qdSNP-Nav, scheme 1(III)).
Cell internalization by CD3-mediated endocytosis
qdSNP-Nav were incubated with biotinylated αCD3 antibody for 1 hour and washed one time with PBS (qdSNP-αCD3, scheme 1(IV)). Jurkat T leukemia cells were kept in logarithmic growth by culture in RPMI-1640 supplemented with 10% FBS. The cells were washed twice with PBS, resuspended in 2 ml of PBS and incubated for 1 h at 4 °C on poly- L-lysine-coated cover slips. HeLa adenocarcinoma cells were seeded onto cover slips and kept in logarithmic grown by culture in DMEM-HG for 24 h. The cover slips were treated with qdSNP-αCD3 in PBS for 4 h at 37 °C in 5% CO2 atmosphere, fixed for 10 min in 3.7% formaldehyde in PBS, and then either stained for 1 h at room temperature with 10 μg/mL Texas Red-conjugated concanavalin A or incubated with rabbit anti-CD107A and then with Texas Redlabeled goat anti-rabbit antibody in PBS containing 5% NGS and 0.1% Triton X-100. VECTASHIELD mounting medium with DAPI (Vector Laboratories, Inc., Burlingame, CA) was used to visualize the nuclear region.
Fluorescent Microscopy
Phase-contrast and fluorescence images of functionalized SNPs were acquired using an Inverted TE300 Nikon (Kanagawa, Japan). Confocal microscopy (Radiance 2100/AGR-3Q, Bio Rad, Hercules, CA) was used to collect fluorescent images. Both 40x and 60x (1.4-oil immersion) objectives were used. To avoid fluorescence interference from salt crystals caused by evaporation of buffer, wet samples were imaged.
Trasmission Electron Microscopy
An aliquot of qdSNP in ethanol was dropped onto the lacey carbon film covering a 300-mesh copper
grid (Tedpella, Inc., Redding, CA) and let to evaporate. TEM images were obtained using a Hitachi H-600A (Tokyo, Japan).
RESULTS AND DISCUSSION
Realization of quantum dot-doped silica nanoparticles decorated with neutravidin TEM images of qdSNP showed uniform diameter (13±1 nm) silica nanobeads. The presence of phosponate groups facilitated the dispersion in PBS and the subsequent steps of coupling of the amino groups to biotin labeling reagents with spacer arm and of decoration with Nav. qdSNP-Nav in PBS remained as a clear solution without visible flocculation for several months, suggesting that the nanoassemblies existed as monodispersed suspension. The latter result was confirmed by the fact that both optical and confocal microscopy showed that qdSNP-Nav in PBS had no distinct fluorescent features (figure 1).
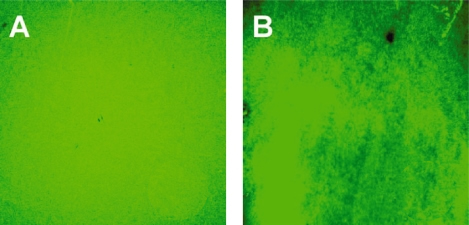
Figure 1
Figure 1 – Optical (A) and confocal (B) fluorescent images of quantum dot-doped silica nanoparticles decorated with neutravidin dispersed in PBS. That both fields displayed uniform fluorescence suggests that the nanoassemblies were fully dispersed in PBS (scale bar approximately 10 μm).
Absorbance spectrum of qdSNP-Nav dispersed in PBS showed a band which was broader and blue-shifted compared to the corresponding 531 nm-centered band in the spectrum of QD dissolved in toluene (figure 2A).
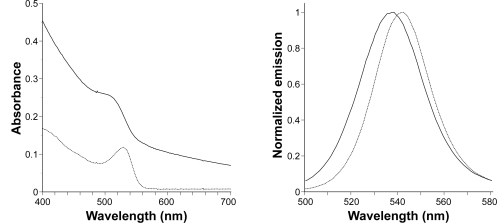
Figure 2
Figure 2. – Absorbance in the visible range (A, far left) and normalized emission (B, left) spectra of quantum dots in toluene (solid line) and quantum dot-doped silica nanoparticles decorated with neutravidin dispersed in PBS (dotted line).
On excitation at 360 nm, the steady-state emission spectrum of qdSNP-Nav in PBS exhibited slightly broader and blue-shifted emission peak compared to that of free QD in toluene (figure 2B and table 1). These results suggest that the encapsulation into the silica host did not affect the emission properties of the semiconducting nanocrystals. Moreover the decoration with neutravidin permitted to stably dissolve the nanoassemblies under physiological conditions and therefore to obtain a potential scaffold for intracellular transporters. Cell internalization by CD3-mediated endocytosis Recently, the transporting of various types of proteins non-covalently and nonspecifically bound to nanoengineered nanomaterials through endocytosis into various adherent and nonadherent mammalian cell lines was reported.
| Sample |
λmax† (nm) | FWHM‡ (nm) |
| QD in toluene | 542 | 28 |
| qdSNP-Nav in PBS | 538 | 32 |
Table 1 – Spectroscopic parameters, maximum emission wavelength and full-width half-maximum, for dipersions of QD in toluene and qdSNP-Nav in PBS (*maximum emission wavelength; ** full-width half-maximum).
We investigated whether qd- SNP-Nav could be used as fluorescently detectable intracellular nanoprobes in Jurkat cells through specific CD3 receptor-mediated endocytosis. qdSNPNav was preliminarly incubated with biotilynated αCD3 to obtain SNP functionalized with αCD3 (qd-SNP-αCD3). Endocytotic uptake pathways are energy- dependent, with optimum uptake occurring at 37ºC and none occurring at 4ºC. Jurkat cells that had been incubated with qdSNP-αCD3 at 37ºC had intense internal fluorescence (figure 3A).
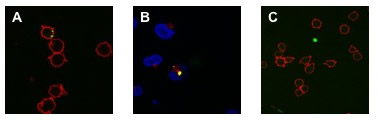
Figure 3
Figure 3 – A: Confocal fluorescent images of qdSNP-Nav internalized into Jurkat T leukemia cells through biotinylated αCD3-CD3 receptor- mediated endocytosis. B: Confocal fluorescent images of qdSNP-Nav internalized into Jurkat T leukemia cells incubated with rabbit anti-CD107A and then with Texas Red-labeled goat anti-rabbit antibody in order to visualize lysosomes. The co-localization of intracellular nanoassemblies (green) and lysosomes (red) indicate that after CD3 receptor-mediated endocytotic uptake, part of internalized qdSNP-Nav were transported to lysosomes. C: Confocal fluorescent images of Jurkat cells treated at 37ºC with SNP-Nav previously incubated with unconjugated αCD3.
Jurkat cells were treated with VECTASHIELD mounting medium with DAPI in order to visualize the nuclear region and to investigate if internalized qdSNP-αCD3 reached the nucleus. Intracellular nanoassembly did not overlap the DAPI stained region suggesting that the nanoassembly, after the endocytotic uptake, was not transported to the nucleus. Further, Jurkat cells were incubated with rabbit anti-CD107A and then with Texas Red-labeled goat anti-rabbit antibody in order to visualize the lysosomes, the organelles that serves to digest macromolecules through digestive enzymes. The presence of co-localized red and green features suggested that after the cellular uptake some endocytotic vesicles released the qdSNP-αCD3 to the lysosomes (figure 3B). Jurkat cells that had been treated with qdSNP-αCD3 at 4ºC or those treated with SNP-Nav previously incubated with unconjugated αCD3 (at 4ºC or 37ºC) exhibited weak internal fluorescence (figure 3C). Moreover, we incubated adherent HeLa cells with qdSNP- αCD3. Extremely weak internal red fluorescence was observed in few cells. These results suggest that without stimulation of the CD3 membrane receptor (qd- SNP-Nav treated with unconjugated αCD3) or in absence of the CD3 surface receptor (HeLa cells) the endocytotic uptake of the nanoassembly was weak, probably due to non-specific interactions between the nanoassembly and hydrophobic regions of the cell surface. On the other hand, we observed that the endocytotic uptake of the qdSNP-Nav was strongly amplified if it occurs by specific CD3 receptor-mediated endocytosis with the αCD3 acting as a bifunctional agent to crosslink the CD3 surface receptor to the nanoassembly through biotin-streptavidin binding. Further, we observed that, once internalized by cells, part of the nanoassembly was transported to lysosomes.
CONCLUSIONS AND FUTURE PROSPECTS
In conclusion we fabricated silica nanobeads doped with quantum dots and coated with neutravidin (qd- SNP-Nav). The resulting nanoassemblies were visible by conventional fluorescent microscope and could be further functionalized with macromolecules, nucleic acids and polymers exploiting the strong affinity between biotin and Nav. This realized luminescent nanoassembly was delivered internally into Jurkat T cells through biotinylated- αCD3-CD3 receptor-mediated endocytosis and was partially released to lysosomes. As such, qdSNPNav represents a potentially excellent scaffold for constructing intracellular multivalent nanoprobes. In the future we plan to use this nanoassembly to investigate whether a synthetic pH-responsive polymer can enhance intracellular trafficking to the cytoplasm or to deliver nucleic acids into a specific cell line.
Experimental Teams: Massimo Bottini, Federica D’Annibale, Eleonora Nicolai, Almerinda Di Venere, Giampiero Mei, Andrea Magrini, Antonio Bergamaschi, Nicola Rosato
References
M. E. Akerman, W. C. Chan, Laakkonen, S. N. Bhatia, E. Ruoslahti. Proc. Natl. Acad. Sci. USA 2002, 99: 12617-12621.
R. P. Bagwe, L. R. Hilliard, W. Tan. Langmuir 2006, 22: 4357-4362.
M. Bottini, F. Cerignoli, M. I. Dawson, A. Magrini, N. Rosato, T. Mustelin. Biomacromolecules 2006, 7: 2259-2263.
M. Bottini, A. Magrini, A. Di Venere, S. Bellucci, M. I. Dawson, N. Rosato, A. Bergamaschi, T. Mustelin. J. Nanosci. Nanotechnol. 2006, 6: 1381-1386.
R. Hardman. Environ. Health Perspect. 2006, 114: 165-172.
Y. W. Lin, C. W. Liu, H. T. Chang. J. Nanosci. Nanotechnol. 2006, 6: 1092-1100.
T. Zhang, J. L. Stilwell, D. Gerion, L. Ding, O. Elboudwarej, P. A. Cooke, J. W. Gray, A. P. Alivisatos, F. F. Chen. Nano Lett. 2006, 6: 800-808.
J. Wang, K. Zhang, Y. Zhu. J. Nanosci. Nanotechnol. 2005, 5: 772-775.
_______________________________________________________________________
Results from BIONANO PROJECT:
Smart Nanomaterials for Biomedical Applications
Participants: Nicola Rosato (Scientific Coordinator), Adalberto Balzarotti, Piero Chiaradia, Maurizio De Crescenzi, Rodolfo Del Sole, Almerinda Di Venere, Giampiero Mei, Pietro Morales, Gaio Paradossi, Fulvia Patella, Riccardo Polini, Wolfgang Richter, Roberto Senesi, Lorenzo Stella, Mariano Venanzi
Related Information
Prof. N. Rosato
Lipoxygenases
Mean Kinetic Energy in Helium mixtures and nanoporous confinement
Collaborative research among scientists from Italy – the Nast Centre for Nanoscience Nanotechnology and Innovative Instrumentation, UK – ISIS Spallation Neutron Source – have studied the single particle microscopic dynamics of helium atoms (3He, 4He) in bulk and confined in silica nanopores, using Deep Inelastic Neutron Scattering (DINS) at the ISIS
Spallation neutron Source. The (DINS) technique provides direct information about single-particle dynamical properties, such as the momentum distribution, n(p), and the mean kinetic energy, <EK>.
Due to its light mass, its zero-point energy is large compared to thermal motions, Helium occupies a special role in condensed matter. The combination of the high zero-point energy with the weak inter-atomic forces gives to helium a unique property: it is the only element in nature with no liquid-solid transition at T=0 K (at atmospheric pressure). For this reason, quantum effects can be observed. On the other hand, other elements have strong interatomic forces or lower zero-point energies and usually their crystallization occurs at a freezing temperature well above that one at which quantum phenomena start to become significant. In the study of helium it is therefore of paramount importance to consider quantum effects, such as exchange effects and increasing of the mean kinetic energy due to the localization (Pauli principle). Moreover, condensed 4He, 3He and helium isotopic mixtures represent the simplest prototype examples of many-body systems, i.e. interacting bosons (4He) and fermions (3He).
Due to confinement or localization effects the <EK> value for helium in nanopores is expected to increase with respect to the value in bulk. In order to see this effect, one usually exploits two kinds of localization: a confinement obtained by adding 3He atoms to 4He, and a space confinement, using nanoporous systems.
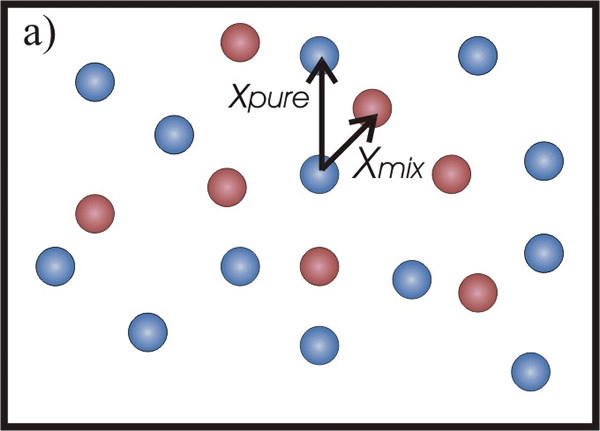 In the first case (Fig.1-a), the 3He atoms border the 4He in a smaller space and the <EK> of the heavier isotope increases. A similar effect should be expected also for 3He mean kinetic energy. However, in this case it has been shown (C. Andreani, C. Pantalei, R. Senesi, “Mean kinetic energy of helium atoms in fluid 3He and 3He-4He mixtures”,Journal of Physics Condensed Matter (2007)) that the lighter isotope seems not to be affected by the presence of the 4He atoms and its kinetic energy seems to be independent of the mixture density. This behaviour can be explained by taking into account exchange effects: the 3He atoms interact with the same kind of isotope, feeling the effect of a density less than that one of isotopic mixture (fig.1-b).
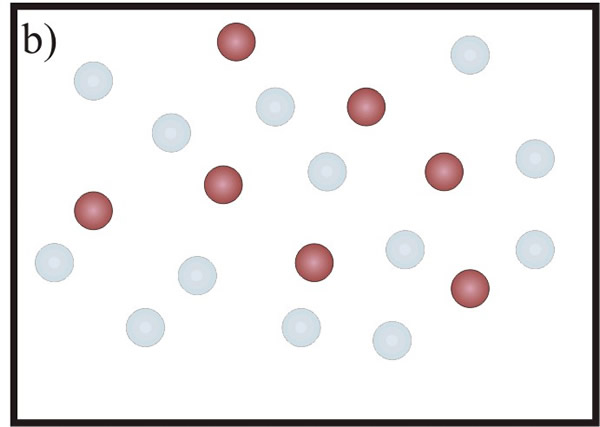
Figure 1: a) Picture of 4He atoms (blue circles). With the addition of 3He atoms (red circles) the mean distance, among a helium atom and its neighbours, decreases (from xpure to xmix). The 4He atom is more localized and its mean kinetic energy increases. b) The 3He atoms is not affected by the presence of the 4He atoms (represented as transparent blue circles).
The other way to localize helium atoms is to confine them in porous powders with mean diameter of pores in a nanometric scale. Several efforts have been devoted to exploring the effect of this kind of confinement on the dynamics of 4He. Studies of adsorption of helium on a variety of surfaces have provided a wealth of information on the behaviour of low-dimensional quantum solids and their interaction with substrates.
The present study (C.Andreani, C. Pantalei, R. Senesi, ”4He adsorbed in cylindrical silica nanopores: size-effects on single atom mean kinetic energy”, Phys. Rev B, 75, 064515 (2007))had the aim of deriving the single-particle mean kinetic energy <EK> of 4He adsorbed in cylindrical silica nanopores (xerogel) for different pore diameters, namely, 24 Å and 160 Å. This study allowed to derive the dependence of single-particle dynamics on pore sizes, layer coverage, and geometry of the confining system.
-
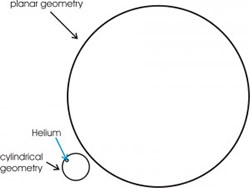
Figure 2: The picture represents, to scale, the two pores, with diameter of 24 Å and 160 Å. For the helium (blue circle) the smallest pore appears as a cylindrical geometry, the biggest one as a planar geometry.
The choice of these two diameter was motivated by the interest to compare different kinds of geometry. In fact, to a good approximation, the corrugation experienced by helium atoms, close to a nanoporous surface, appears as a cylindrical surface, for the smallest one, and as a planar surface, for the biggest one (fig. 2).
The single-particle dynamics of confined helium atoms is shown to be significantly affected by confinement and the <EK> values of helium adsorbed in xerogel powders are found significantly higher than those in bulk liquid. In particular, the mean kinetic energy increases by reducing the pore size. In this case, the behaviour of the kinetic energy is due to different reasons with respect to that explained in the case of the mixtures.
Figure 3: The helium atoms (blue circles) arrange themselves in concentrical annuli, beginning with a first layer close to the surface. The number of atoms in each layer depends on the ratio between helium atom and pore diameters.
In such nanoporous systems, a microscopic structural model assumes that the 4He atoms are arranged in concentric annuli along the cylindrical pore axis(Phys. Rev. B 72, 064516 (2005)), with the number of atoms in each layer depending on the ratio of the helium diameter to the pore diameter (fig. 3). The resulting mean kinetic-energy values are interpreted with a model of uncorrelated sum of contributions of two kinds of layers: liquid-like layers (giving a contribution in energy equal to the liquid bulk energy) and solid-like layers (with a higher energy contribution). In the case of 4He adsorbed in pores of 24 Å diameter, the experimental mean kinetic-energy value is well reproduced by assuming a single solid-like layer, with all other inner layers in the liquid phase. For the 4He adsorbed in pores of 160 Å diameter, the surface roughness plays a relevant role and the result is interpreted in terms of three solid-like layers. In fig 4 it is reported the mean kinetic energy as function of the fraction, f, between the number of atoms in the solid-like layers and the number of atoms in the liquid-like layers. The value of franges from f=0 (corresponding to the liquid bulk) to f=1 (corresponding to have only 1 solid-like layer), passing through the intermediate values, corresponding to a cylindrical and to a planar geometry.
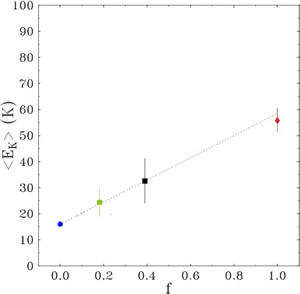
Fig. 4. Single-atom mean kinetic energies as a function of the ratio, f, between the number of atoms in solid and liquid layers. Blue circle: bulk liquid value. Squares: experimental value of <EK> for helium in xerogel powder (24 Å, black square; 160 Å, green square). Red diamond: experimental value of <EK> for helium adsorbed in active carbon fibers, (i.e., monolayer coverage, f=1, and slit geometry, (J. Phys.: Condens. Matter 11 No 35 (1999) ). The three experimental values for confined helium correspond to a transition from planar (160 Å pore diameter) to cylindrical (24 Å pore diameter) to slit geometries.
The co-authors on the papers
C. Andreani, C. Pantalei, R. SenesiReferences
- C.Andreani, C. Pantalei, R. Senesi, ”4He adsorbed in cylindrical silica nanopores: size-effects on single atom mean kinetic energy”, Phys. Rev B, 75, 064515 (2007).
- C. Andreani, C. Pantalei, R. Senesi, Mean kinetic energy of helium atoms in fluid 3He and 3He-4He mixtures,Journal of Physics: Condensed Matter 18, 5587 (2006).
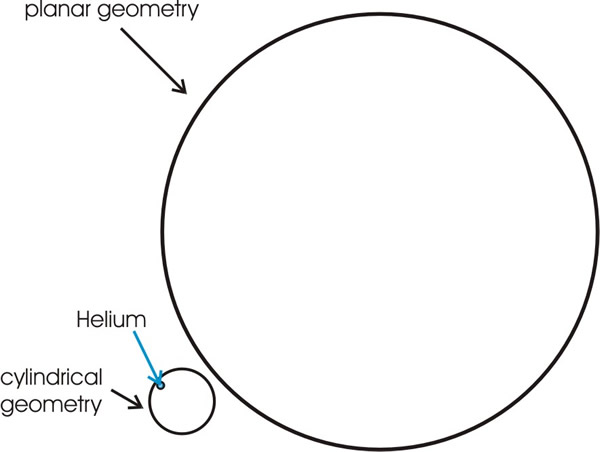
Notes to editors. Other inelastic neutron scattering studies at high wavevector performed on liquid and solid 3He and 4He, and on 3He–4He mixtures via Deep Inelastic Neutron Scattering (DINS).
Contact details:
For more information, please contact Dr. Claudia Pantalei, tel: +39 06 72594429, E-mail
Related Information
Dr. R. Senesi, Prof. C. Andreani
DINS